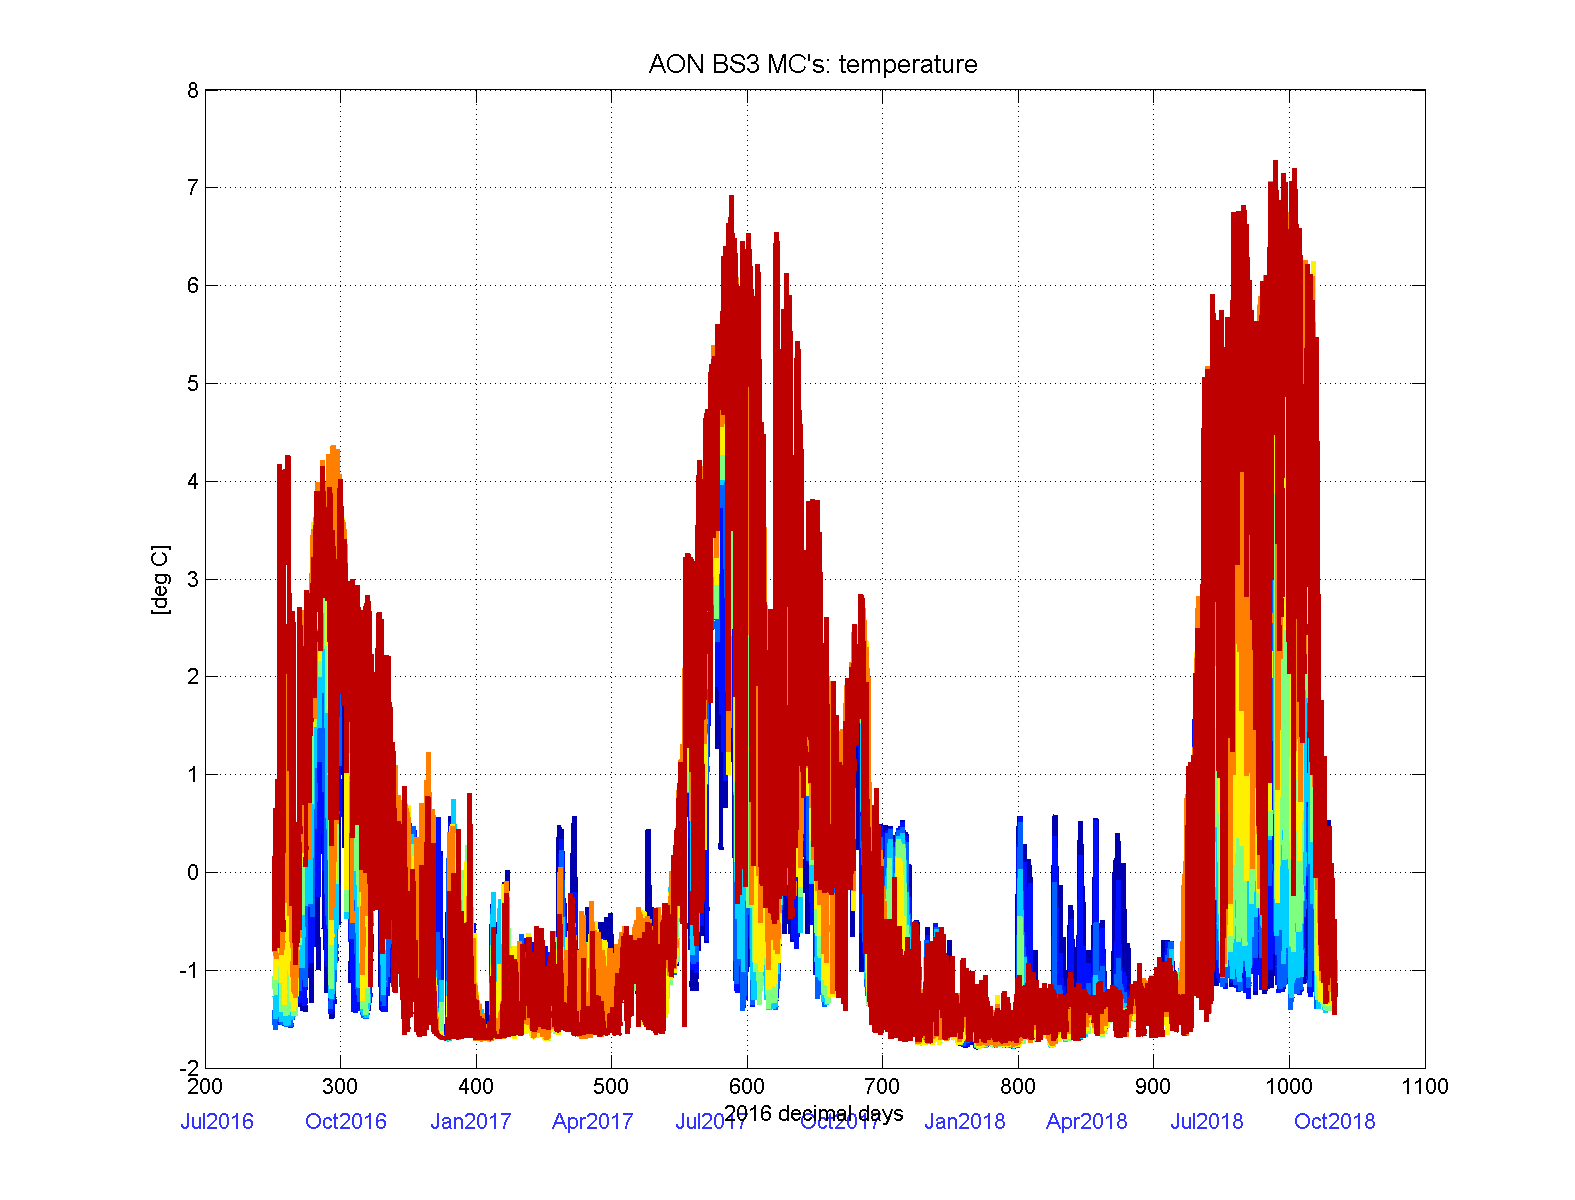
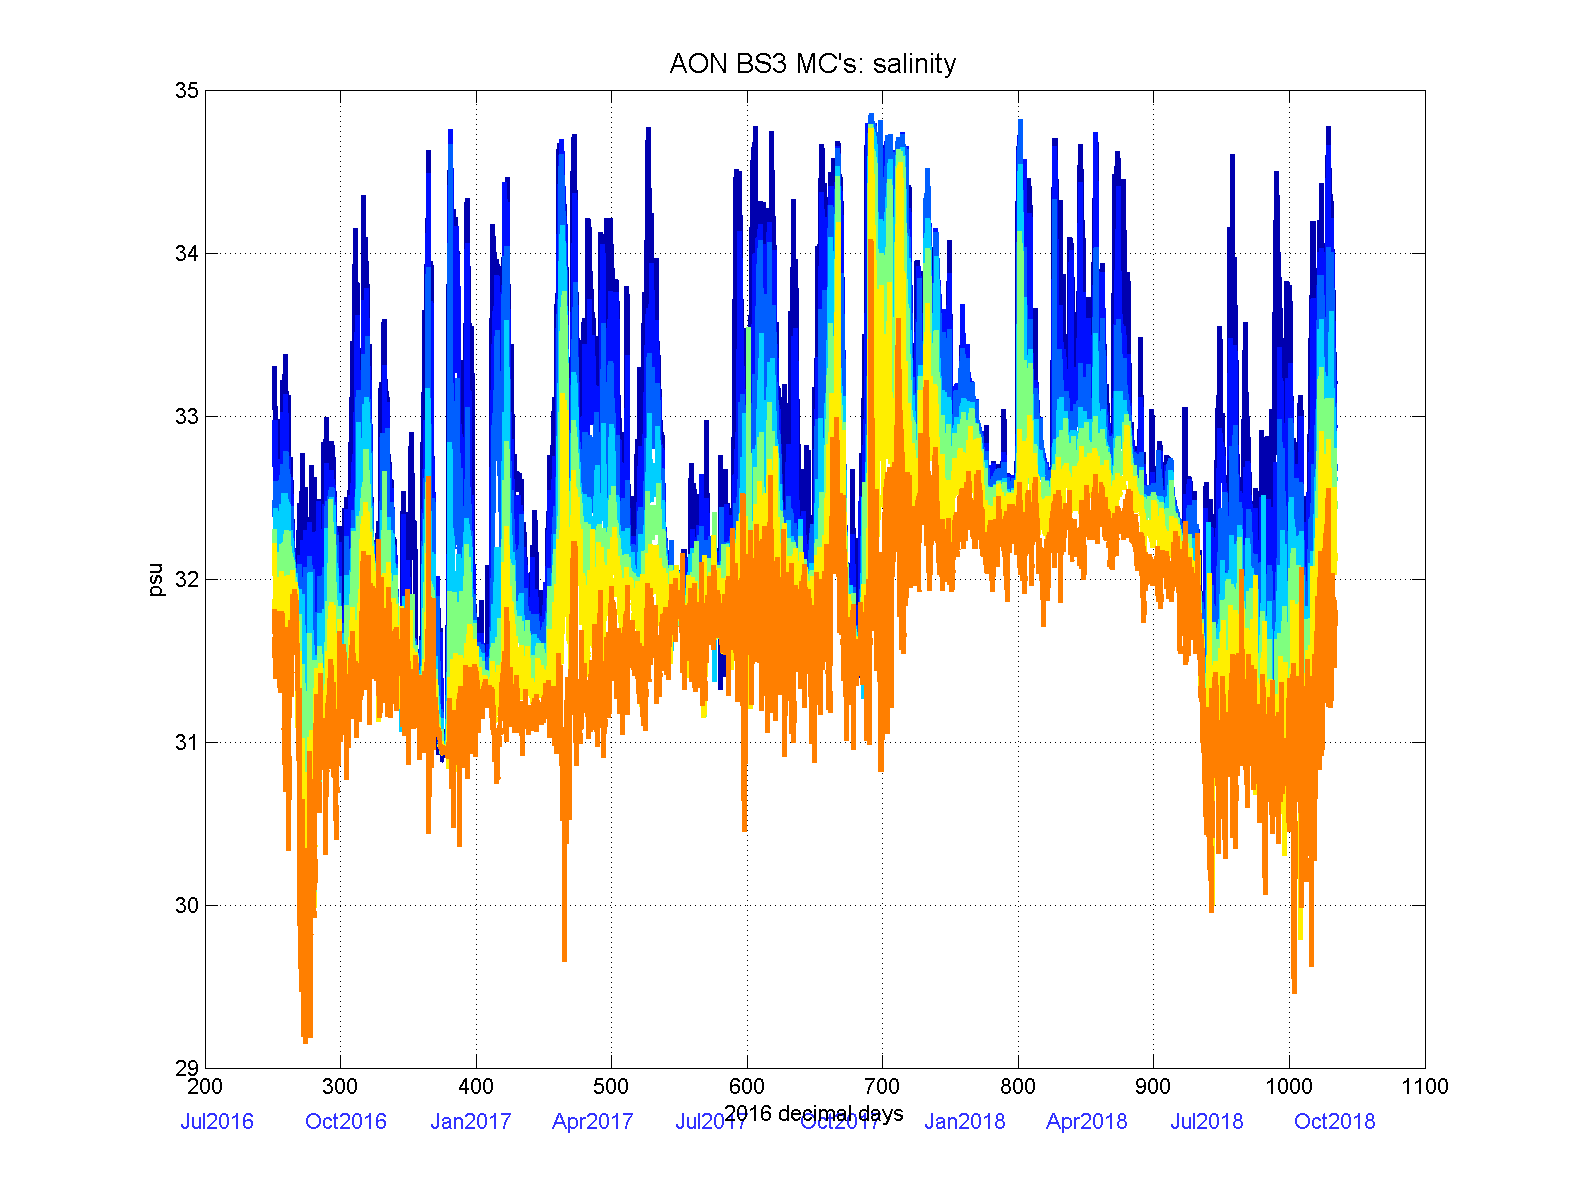
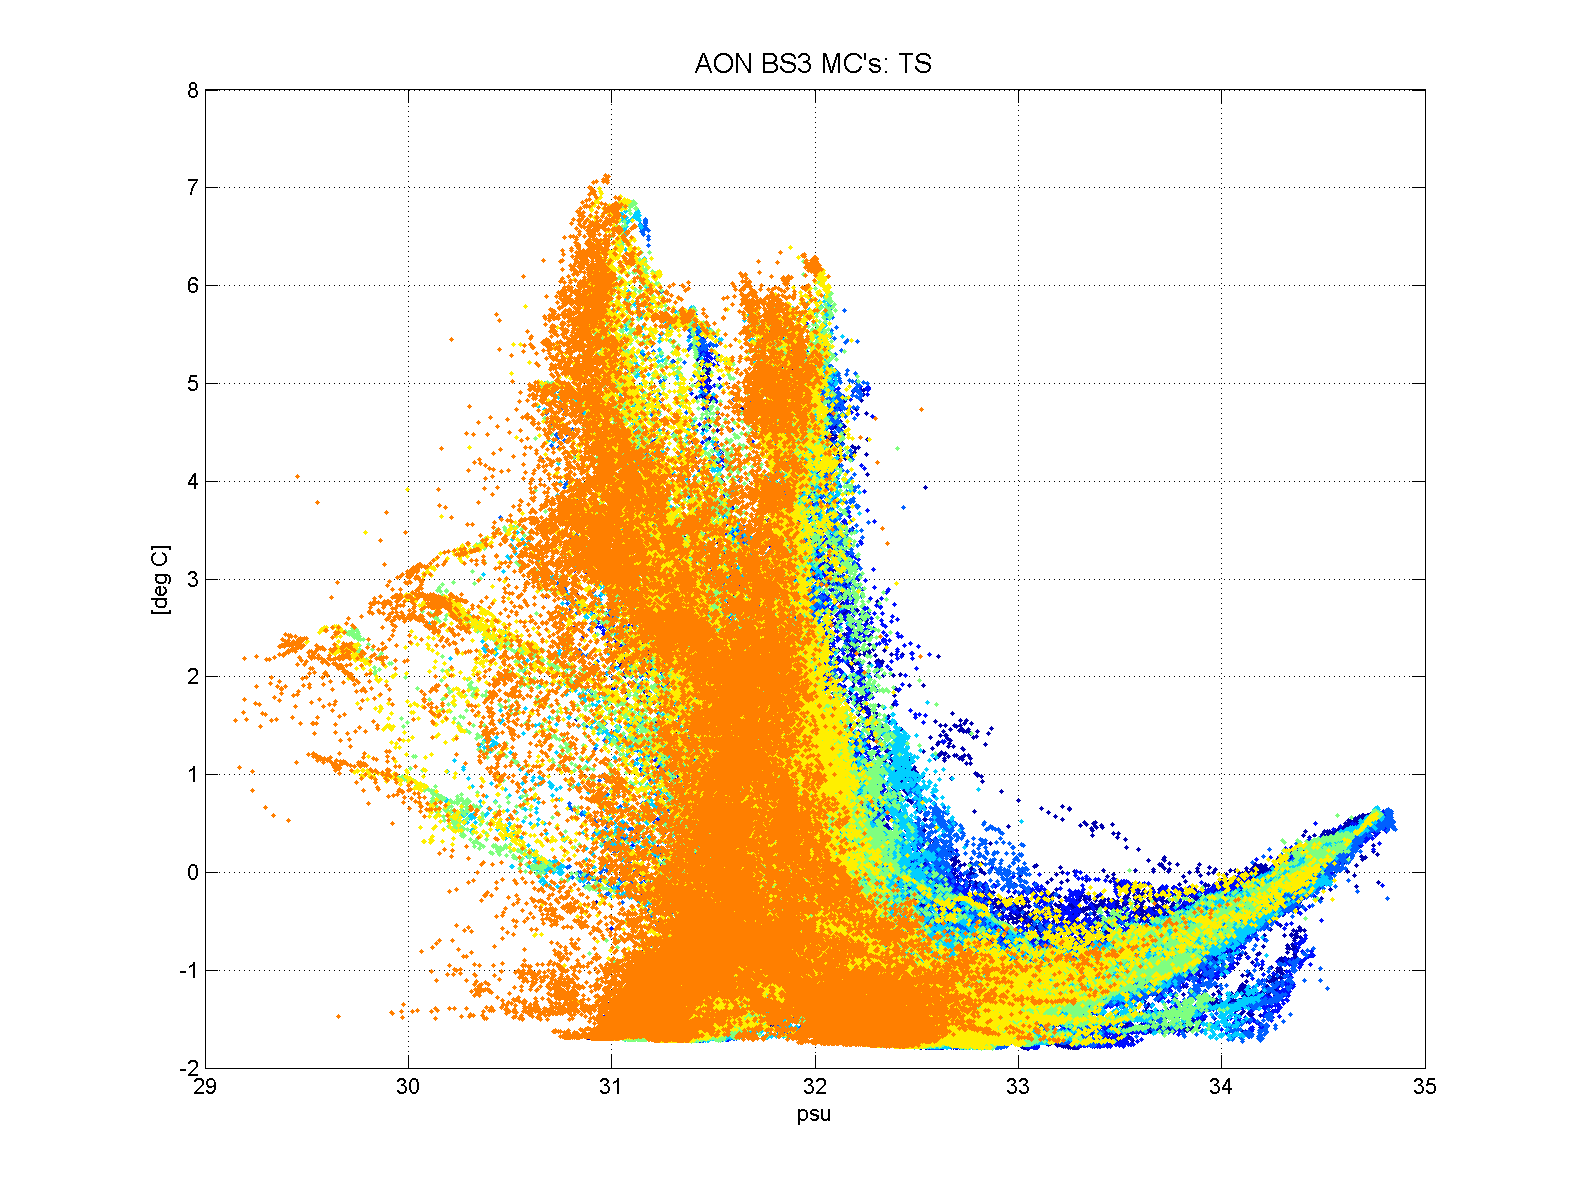
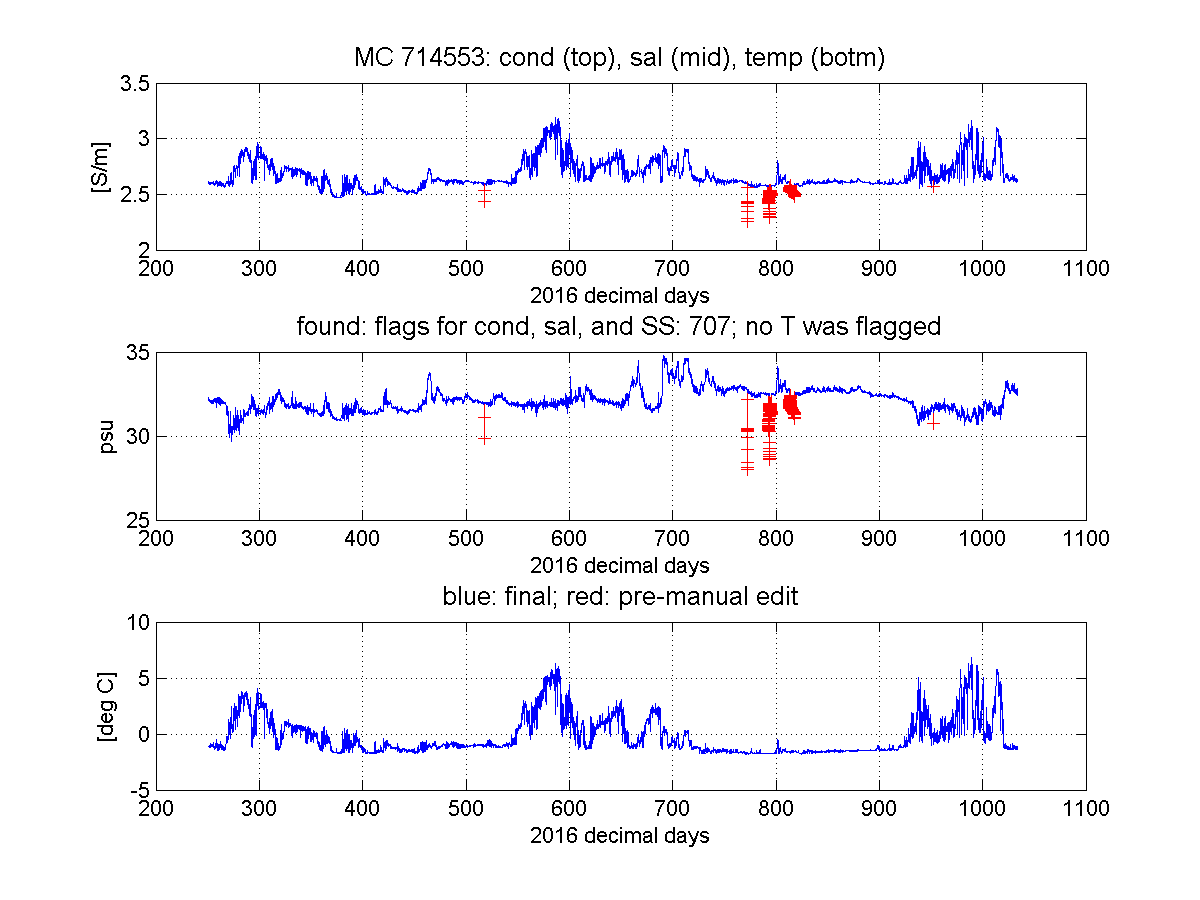
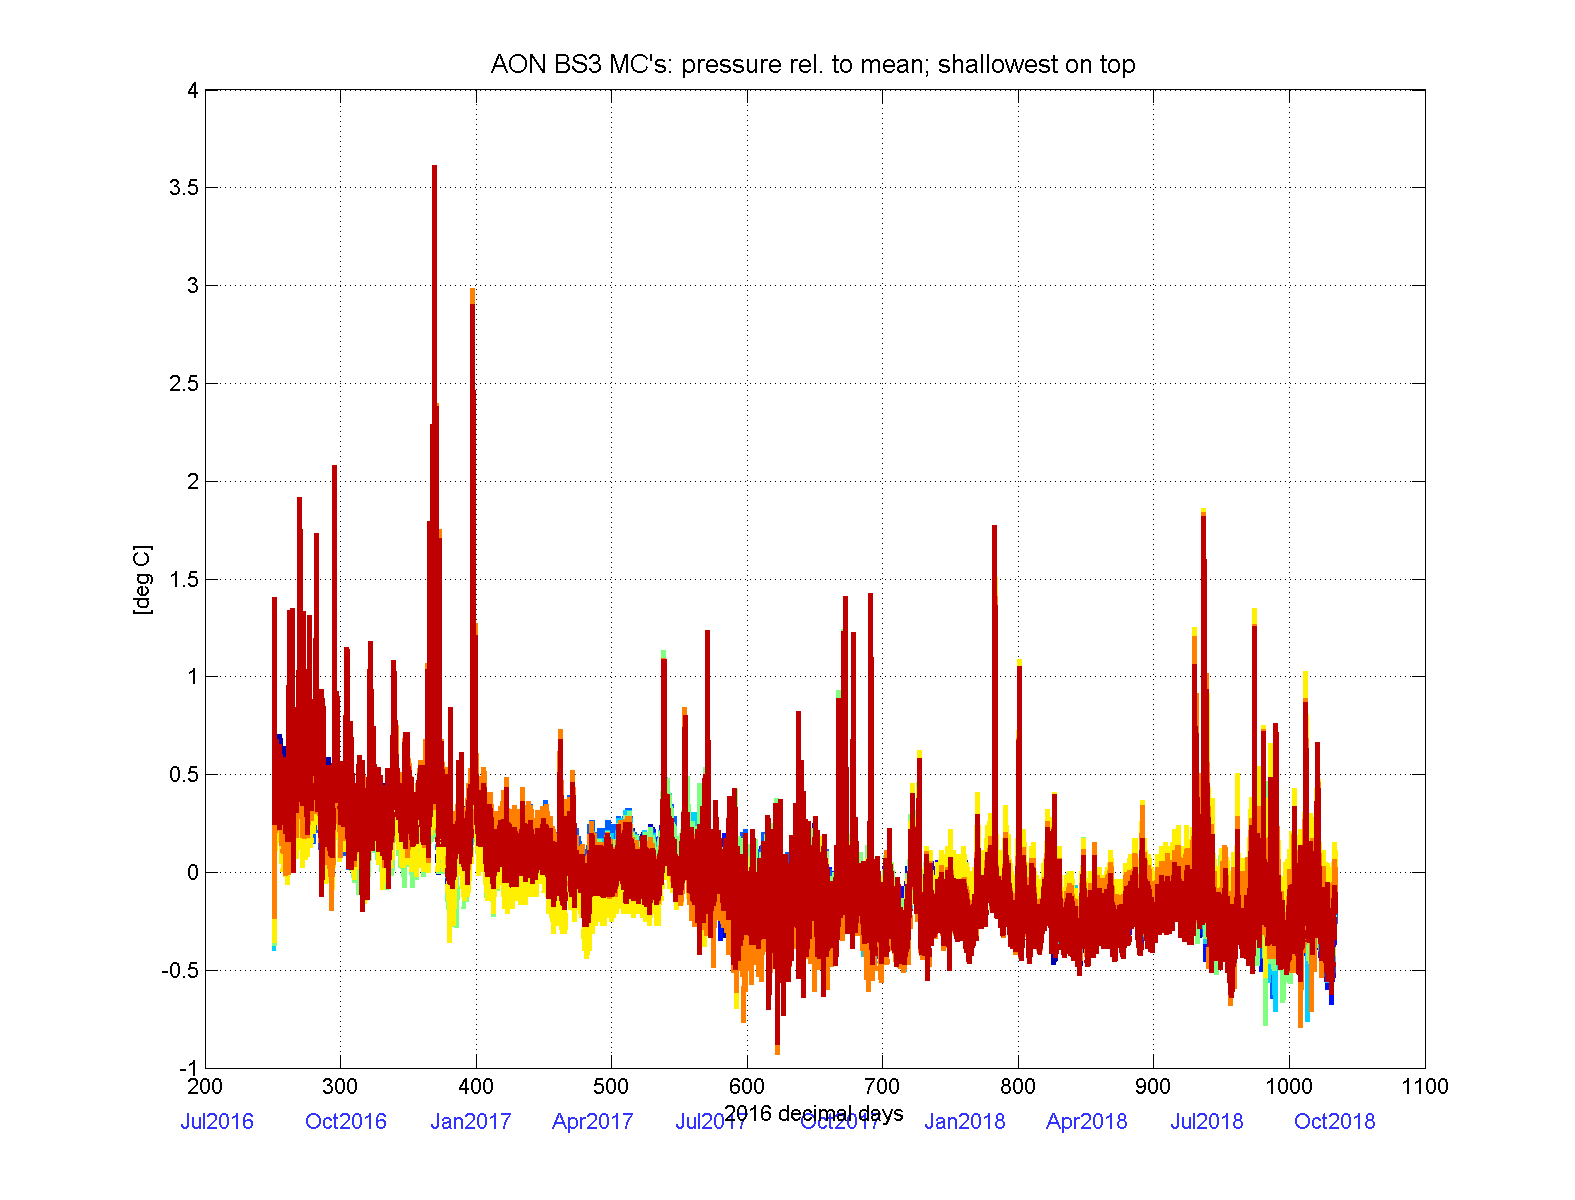
Deployment 2016 to 2018
series of eight microcats
final data
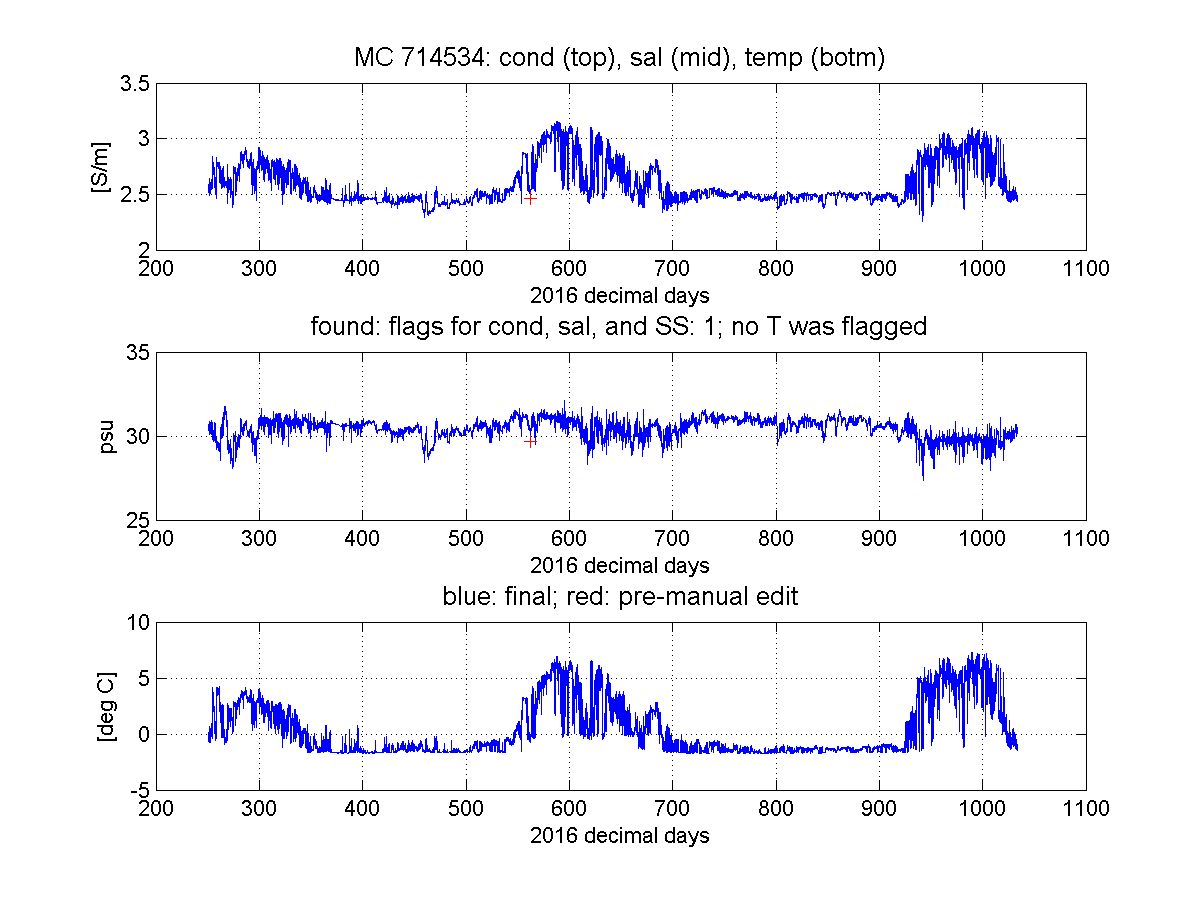
sal and cond for the shallowest MC (ser# 14534)
have been edited out (set to NaN)
due to sensor malfunction

Deployment summary:
Duration: Sept 8, 2016 to Oct 28, 2018
Variables measured: pressure, temperature, conductivity
Sensor information: SBE37-SM example microcat brochure
Instrument settings: sampling interval 15 minutes
    latitude to use for depth calculation = 71.33 deg;
Calibration:applied, based on pre- and post cruise SeaBird laboratory calibration; described here
Final data: matlab format
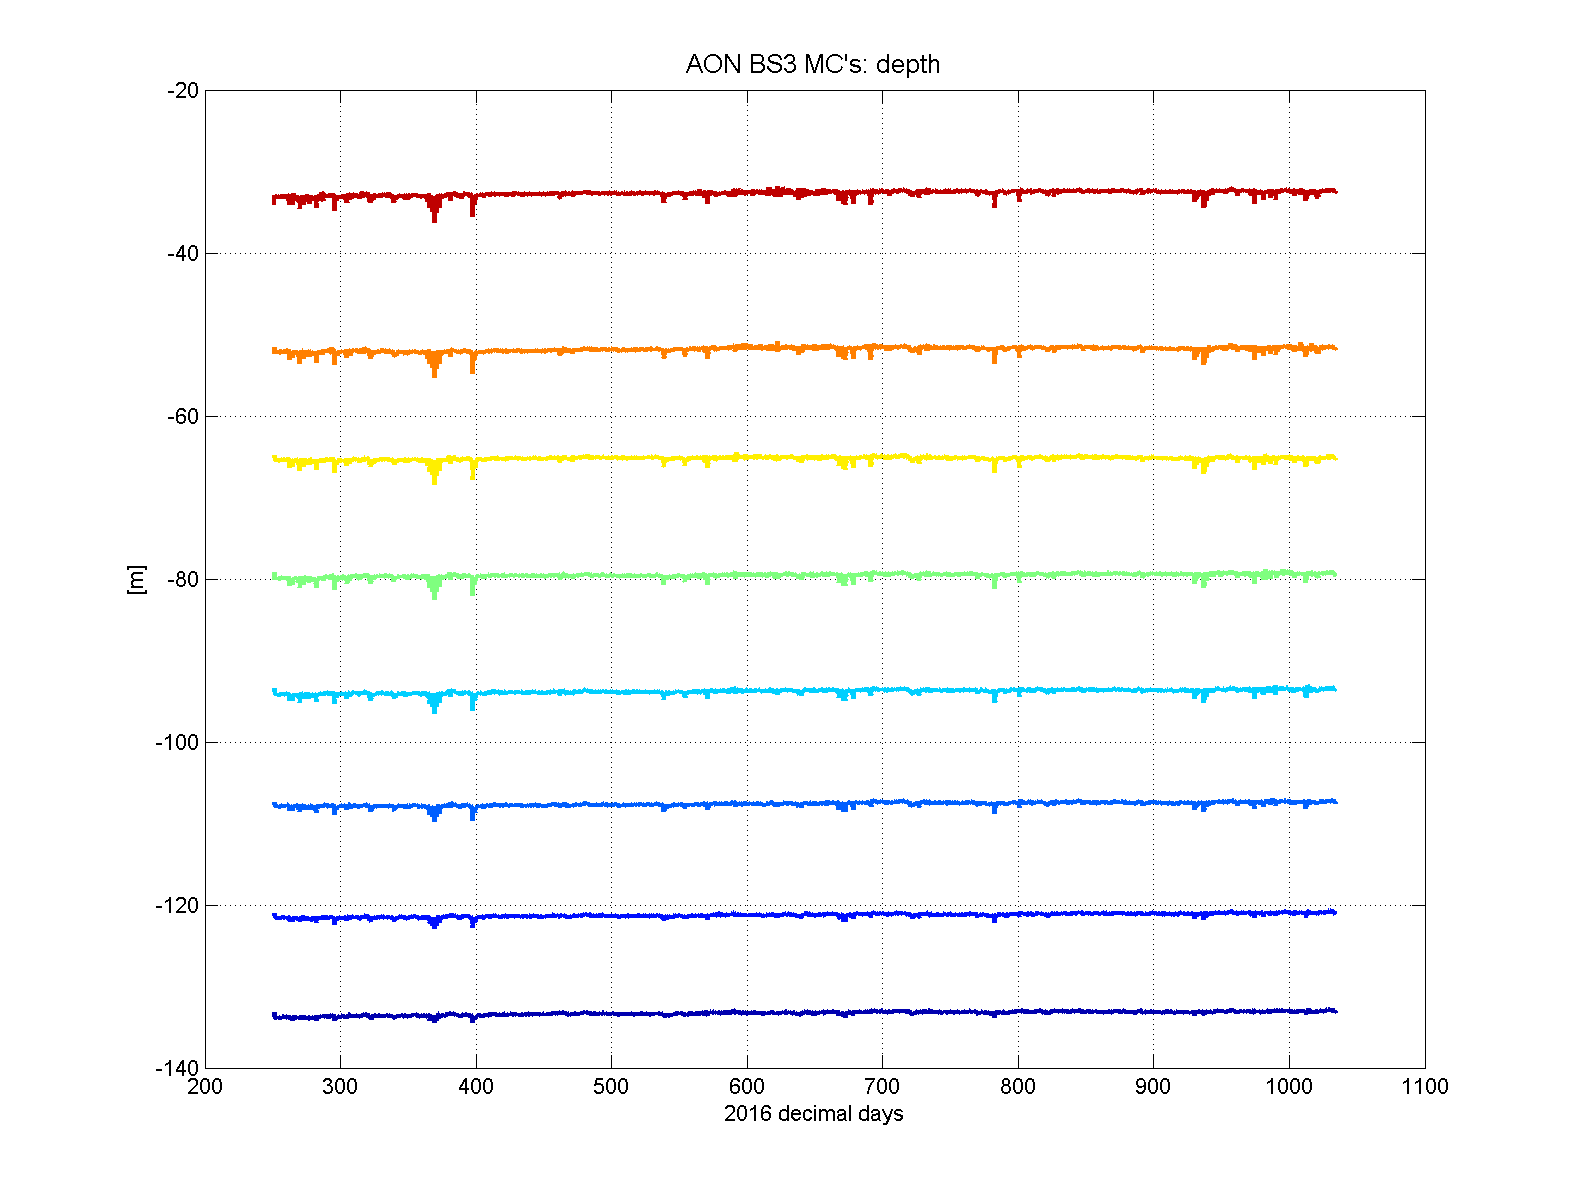
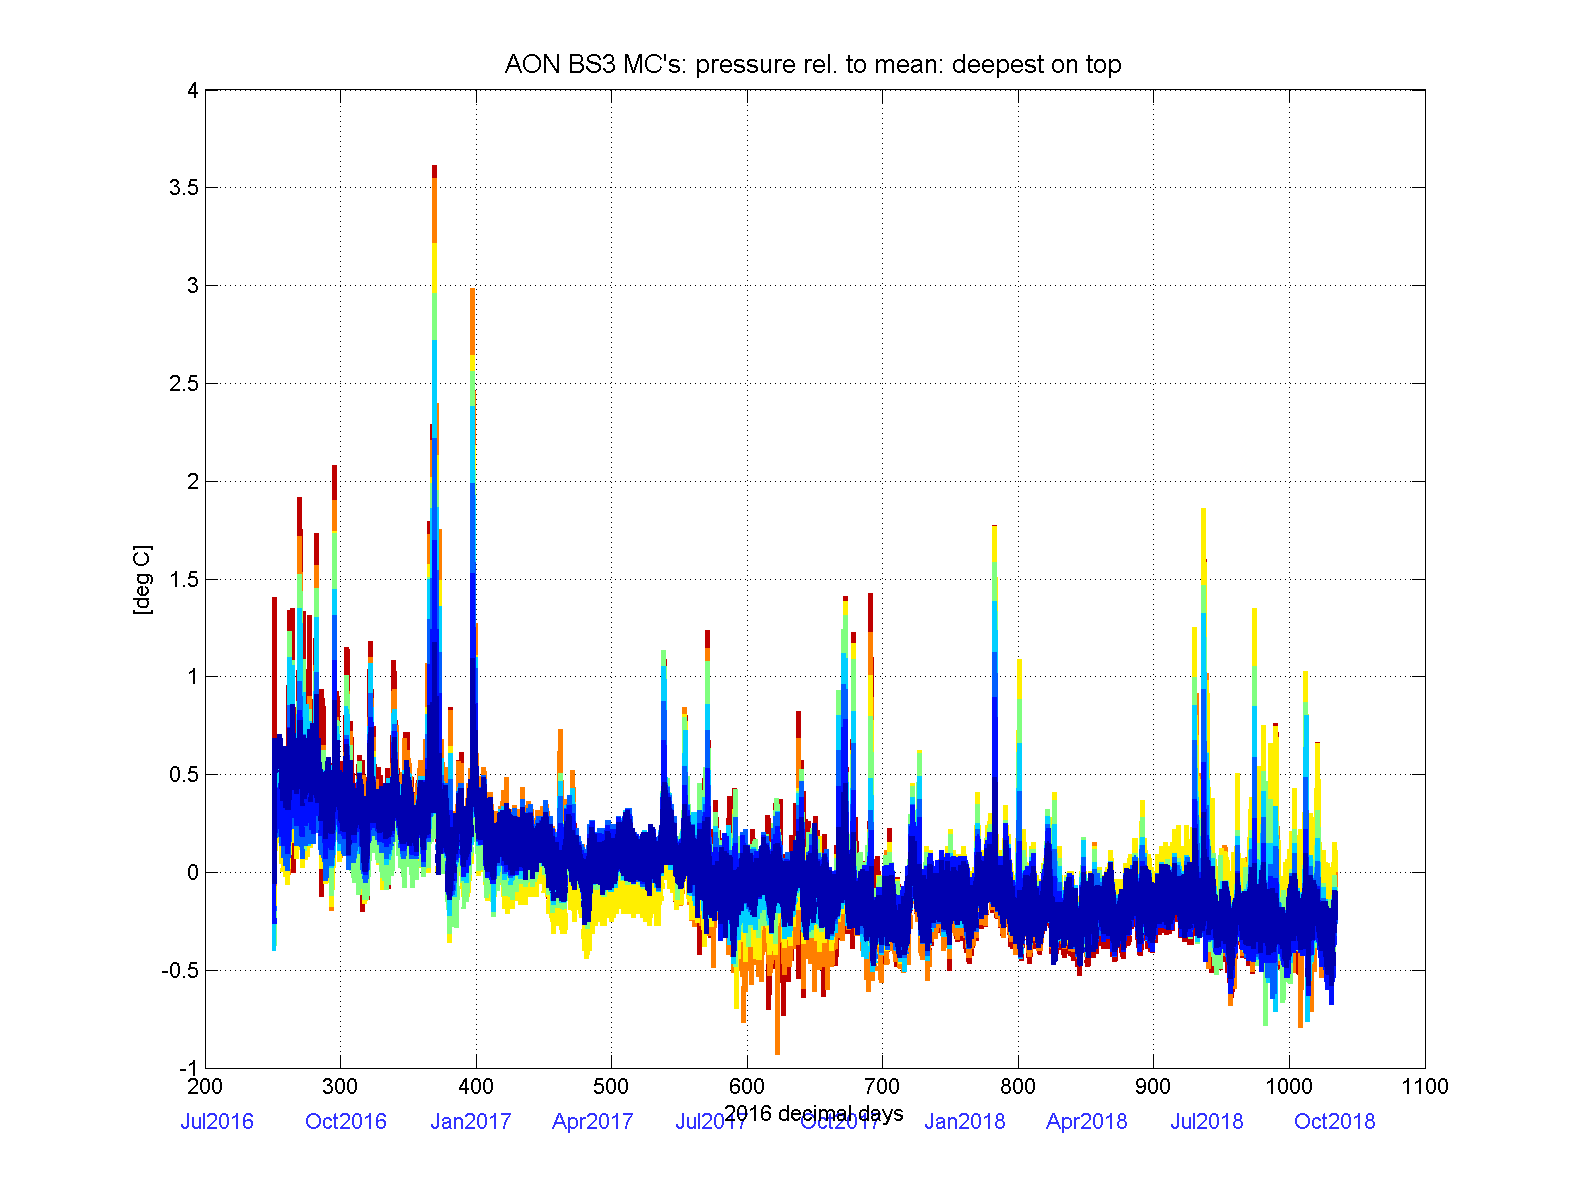


Instrument setup:
The following instruments were provided by Brian Hogue's mooring shop:

SBE37SM-RS232 firmware version 3.1 serial no. 14534
SBE37SM-RS232 firmware version 3.1 serial no. 14535
SBE37SM-RS232 firmware version 3.1 serial no. 14551
SBE37SM-RS232 firmware version 3.1 serial no. 14552
SBE37SM-RS232 firmware version 3.1 serial no. 14553
SBE37SM-RS232 firmware version 3.1 serial no. 14554
SBE37SM-RS232 firmware version 3.1 serial no. 14555
SBE37SM-RS232 firmware version 3.1 serial no. 14556

They were configured to record temperature, conductivity, and pressure
at 15-minute intervals.


Data processing and calibration:

Following mooring recovery, the microcat data were downloaded onboard Healy.
A clock check indicated that all microcat clocks were accurate to within 1 minute.
Once the Healy had been offloaded in Seattle in late November, the instruments
were sent on to SeaBird Electronics for a post-cruise lab calibration. Comparisons
to pre-cruise calibrations indicated that most instruments had drifted little during
deployment: around 0 to 2 mdeg C for temperature, and not more than 0.004 S/m for
all but one conductivity cell. The calibration sheets, as well as summary plots
of the corrected drift, can be found here.

The shallowest microcat, serial # 14534, unfortunately showed a very
large drift of around 1 psu. Also, SeaBird did not provide a post-cruise
calibration sheet for this instrument, but only the results following sensor
repair. We removed (set to NaN) the conductivity and salinity data for this
instrument.

All sensors underwent visual editing to check for contaminations of the conductivity
cells, and similar common errors. Microcats typically include a small number
of short-term salinity spikes. Particularly those without a corresponding
temperature signature were considered conductivity cell contaminations and
removed (see the salinity time series plots below, with removed spikes in red).

The pressure sensor calibrations did not indicate a significant change between
pre- and post-cruise calibrations. However, all showed a slow change towards
slightly lower (shallower) readings by roughly 0.75 dbar over the course of the
two-year deployment (see figures below). This overall shoaling would in principle
be consistent with a stretching of the mooring wire. However, in this case one
might expect that the shallowest pressure reading would change more than the
deepest one, as there would be more wire to stretch for the top microcat. Instead,
all pressure sensors appear to change by roughly the same amount. An alternate
theory would be an asumptotic adjustment of the sensors themselves (all eight
microcats were relatively new). We have not seen such behavior during earlier
BS3 deployments.


Data access
Each microcat dataset was saved in the familiar format of one instrument
per matlab .mat file. On-deck times prior to deployment and after recovery
were nan'ed out. The data files can be found here.