

Deployment 2016 to 2018
temperature and conductivity calibration
temperature and conductivity calibration
|
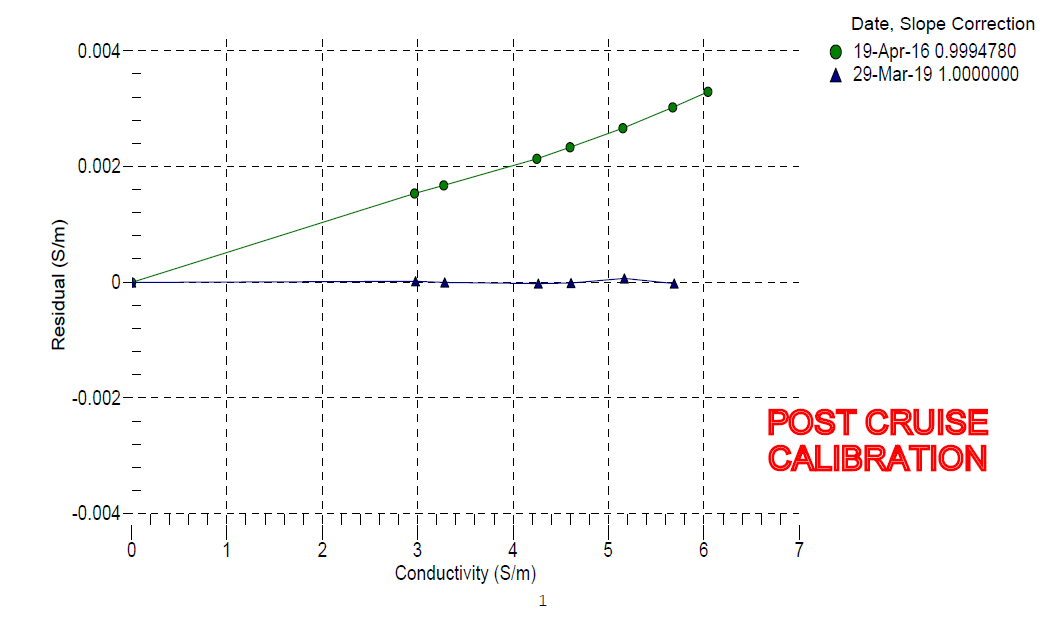
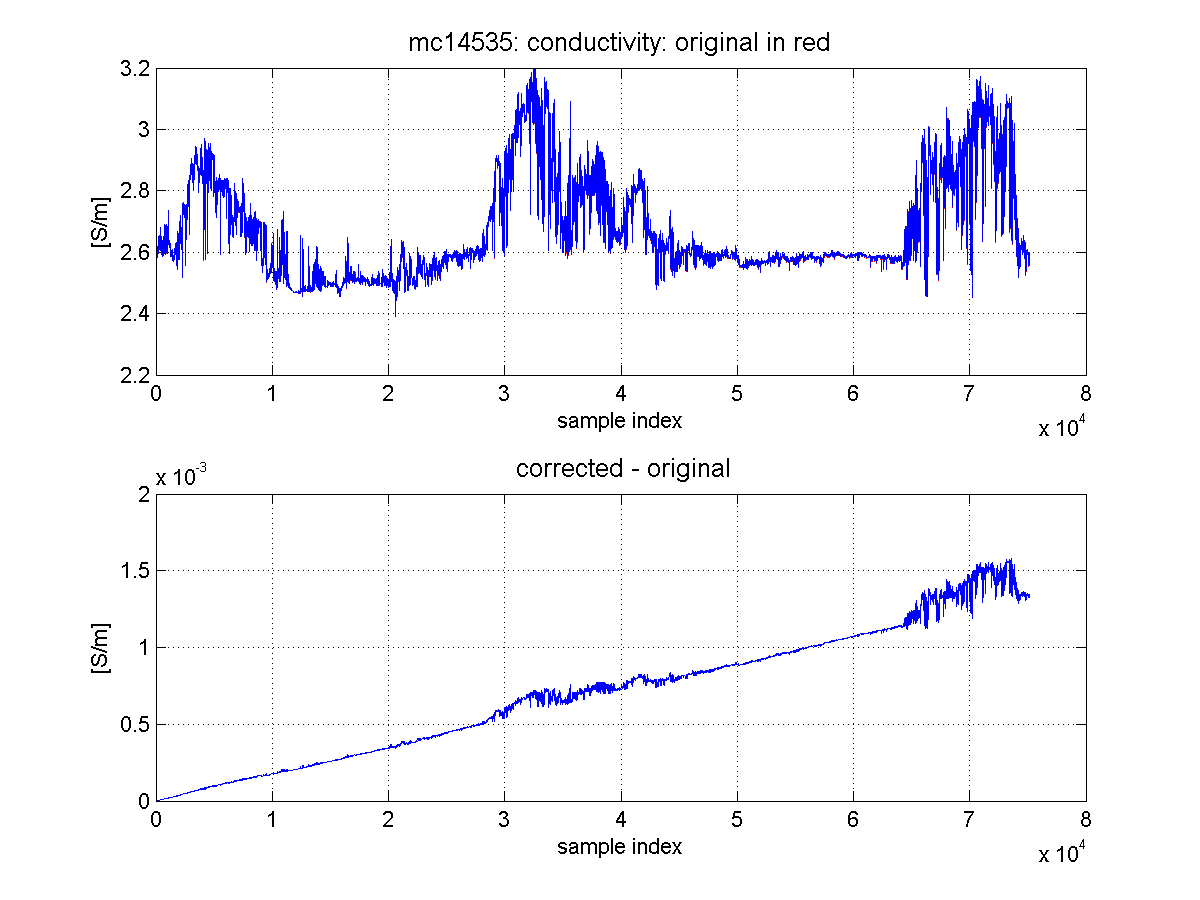
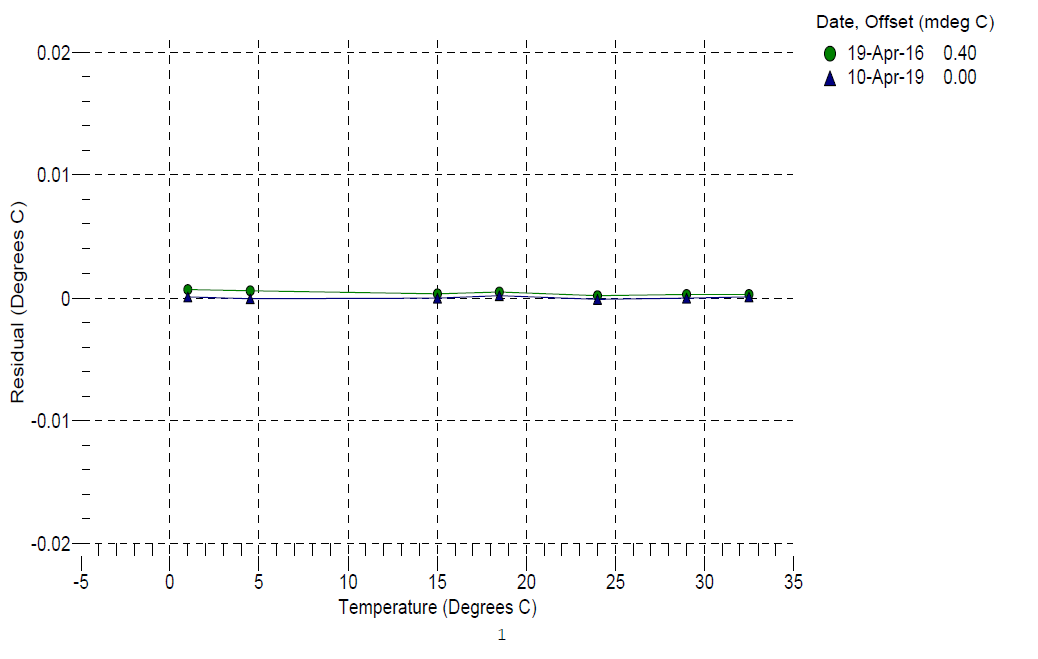
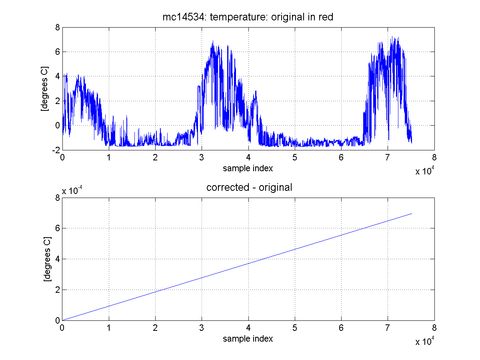
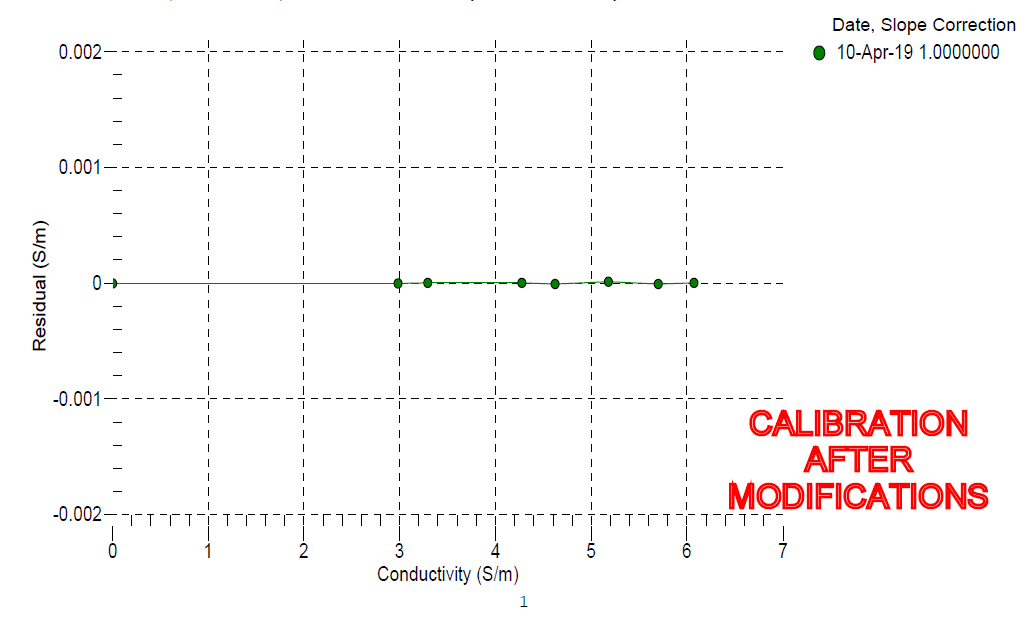
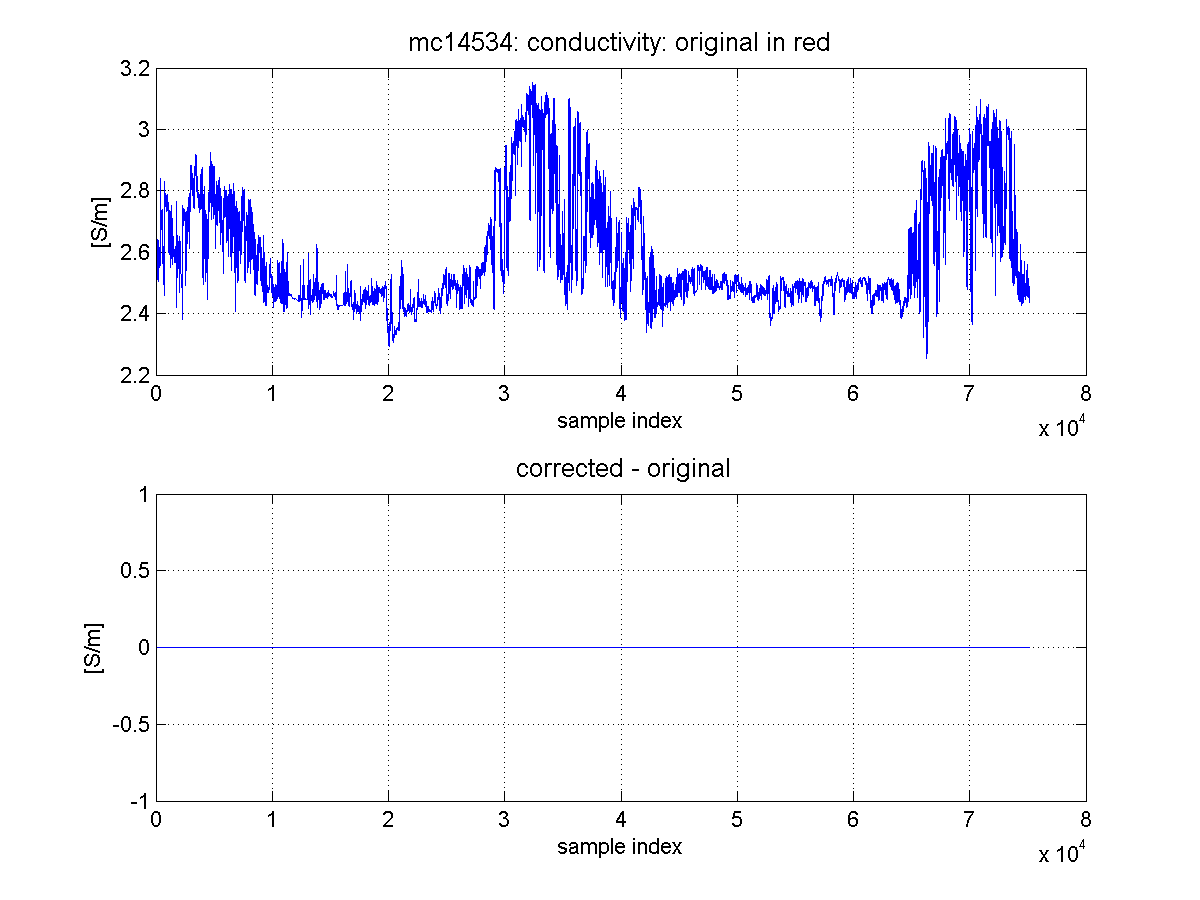
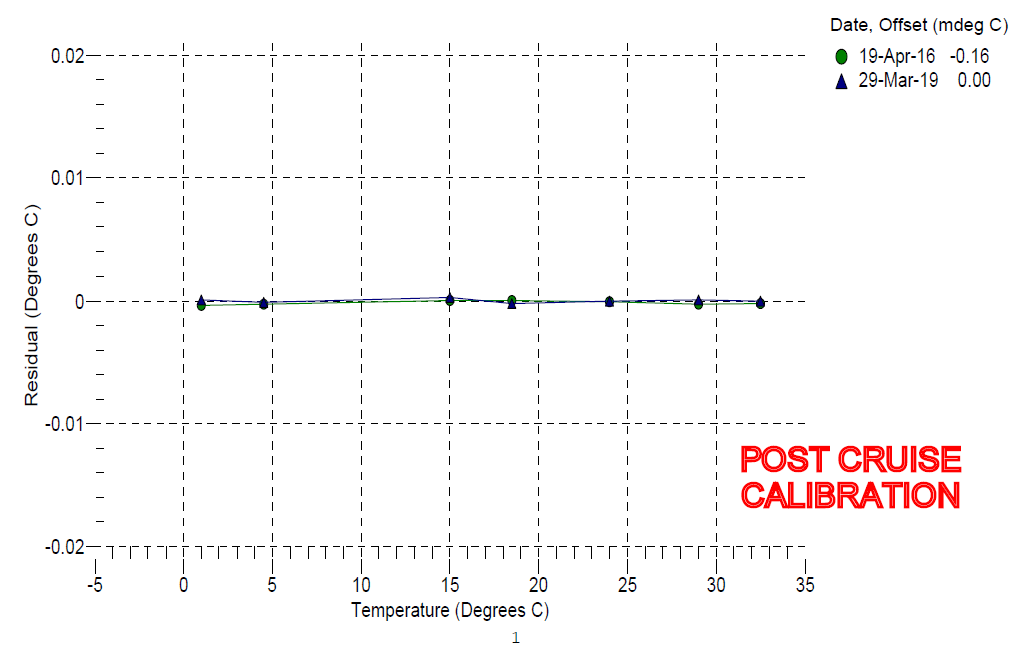
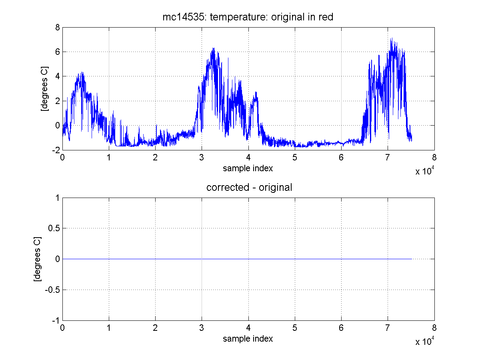
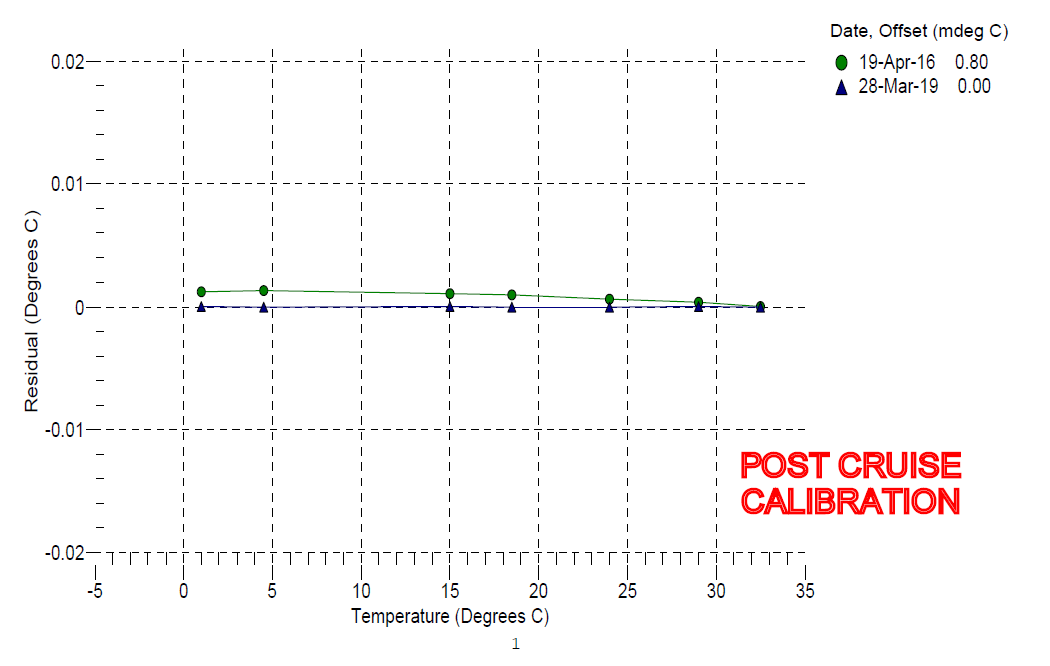
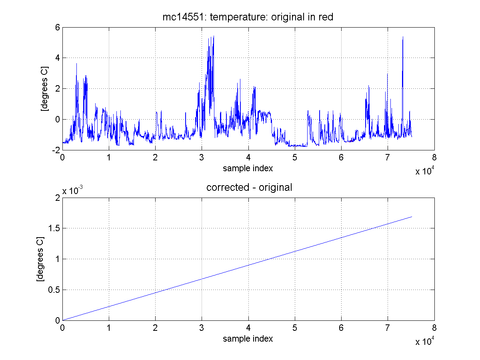
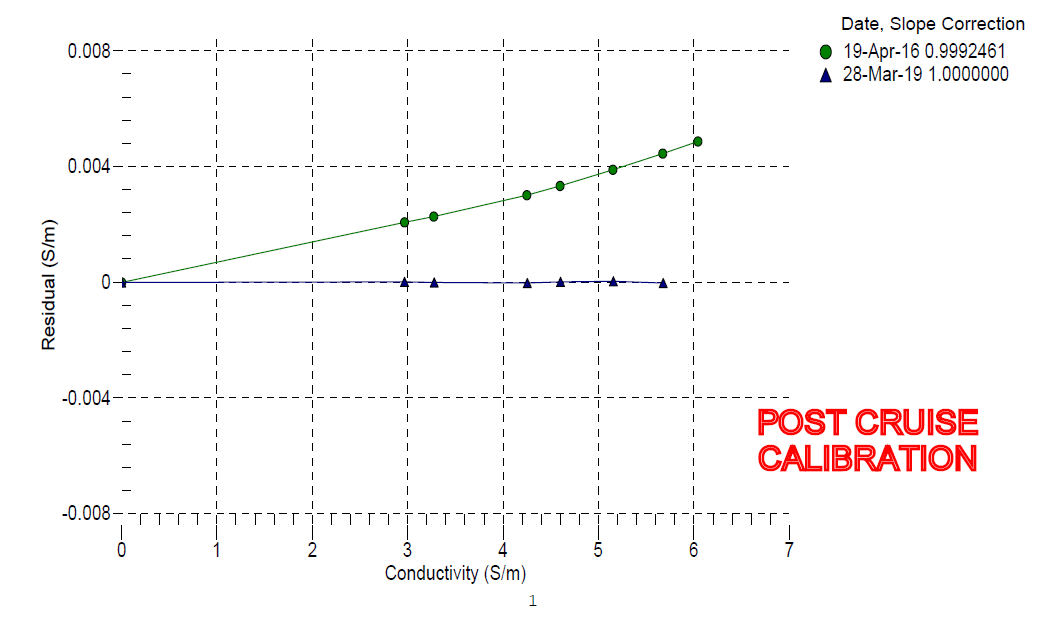
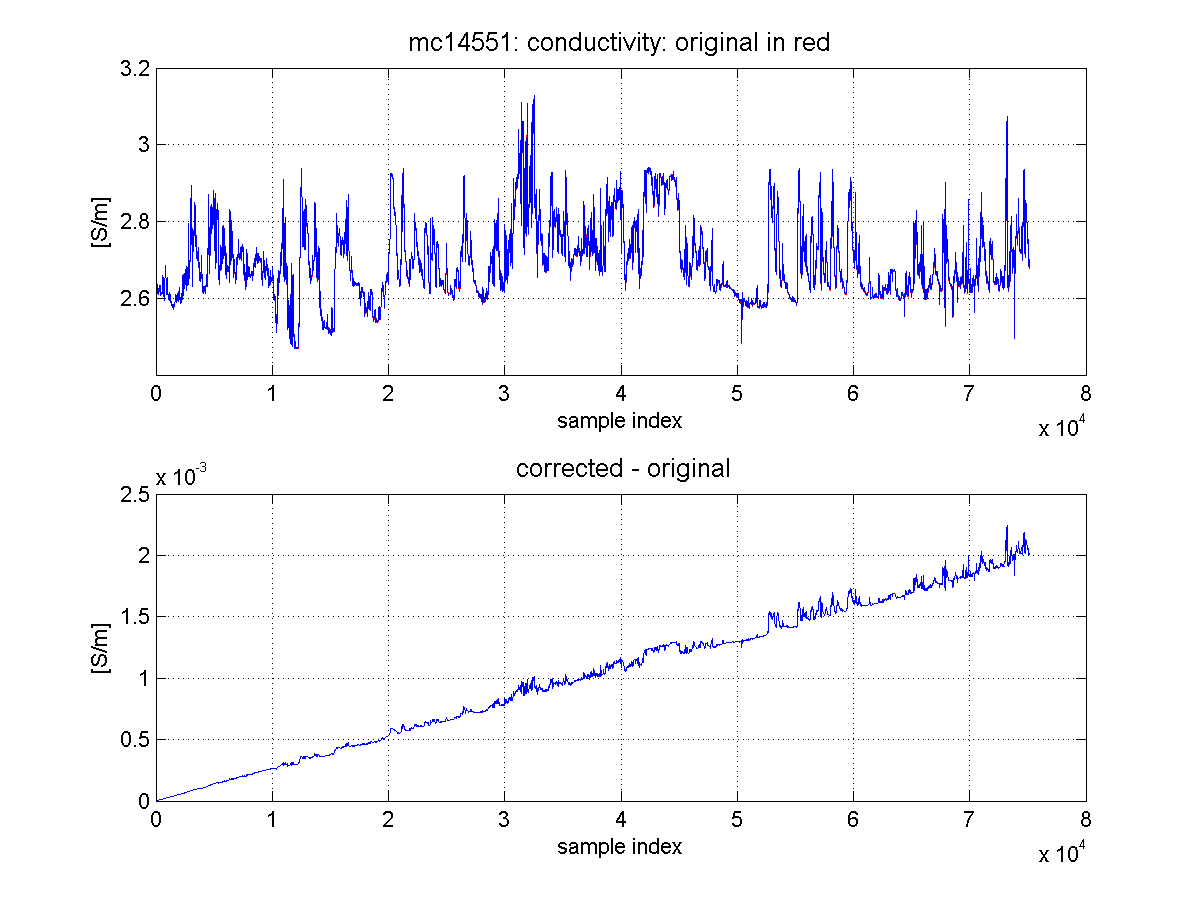
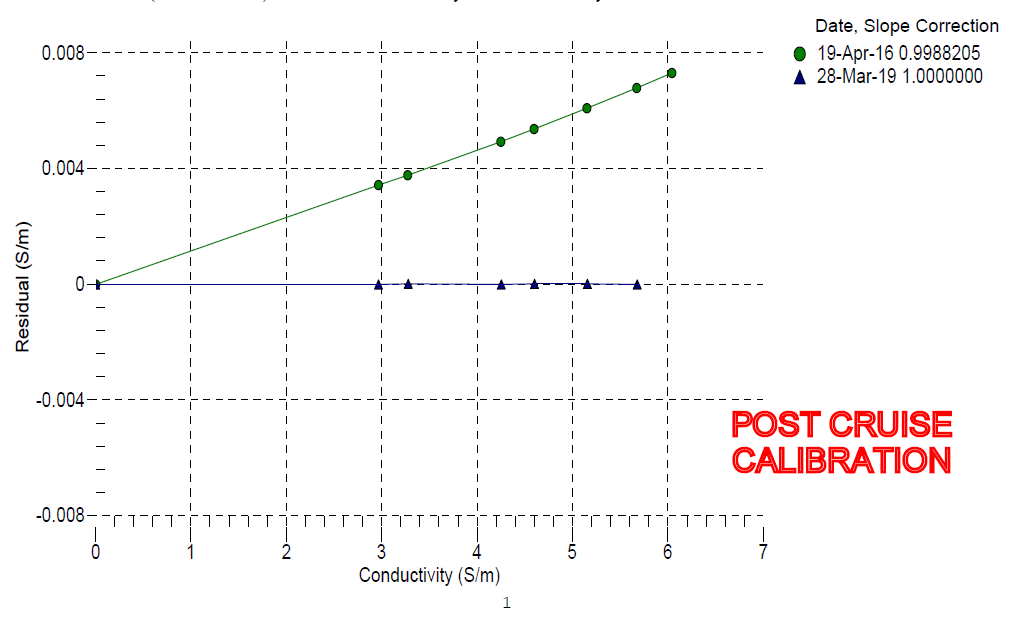
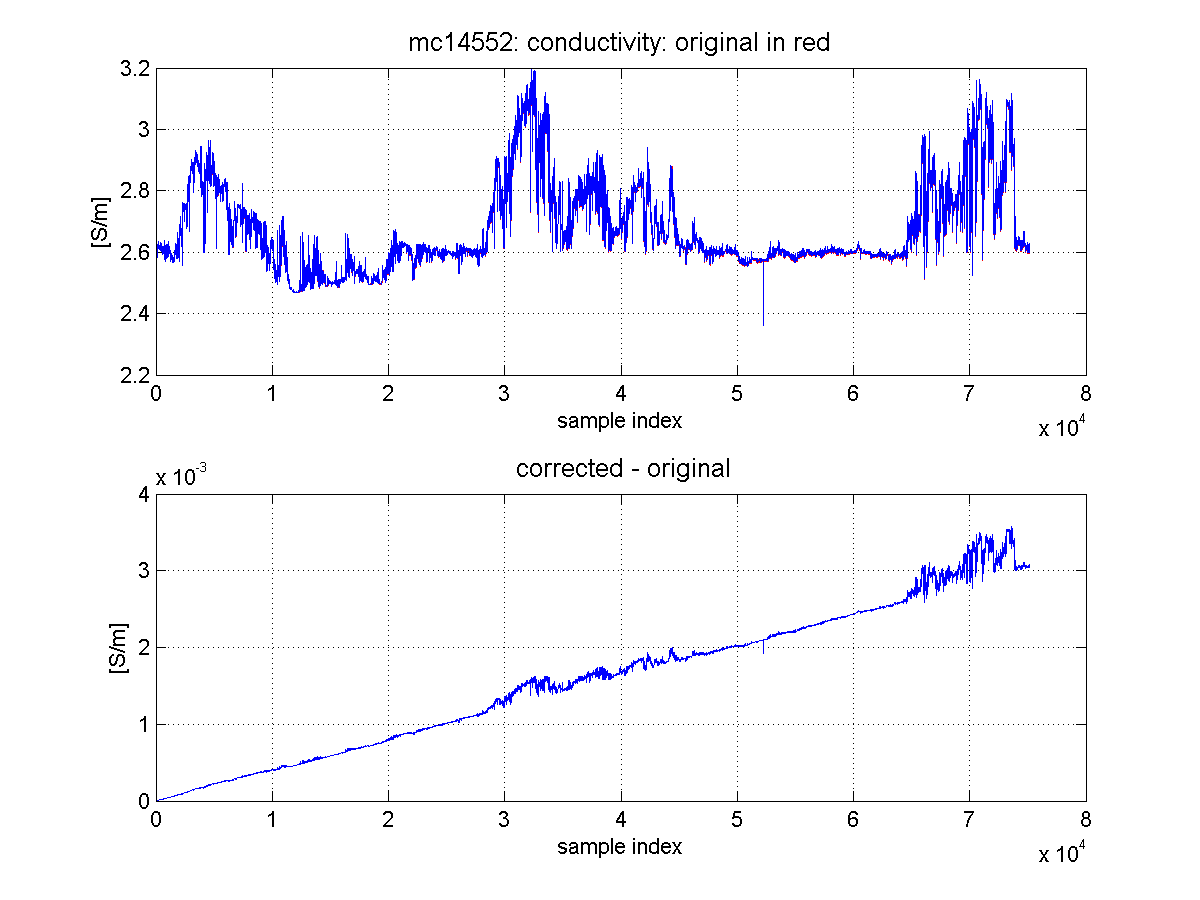
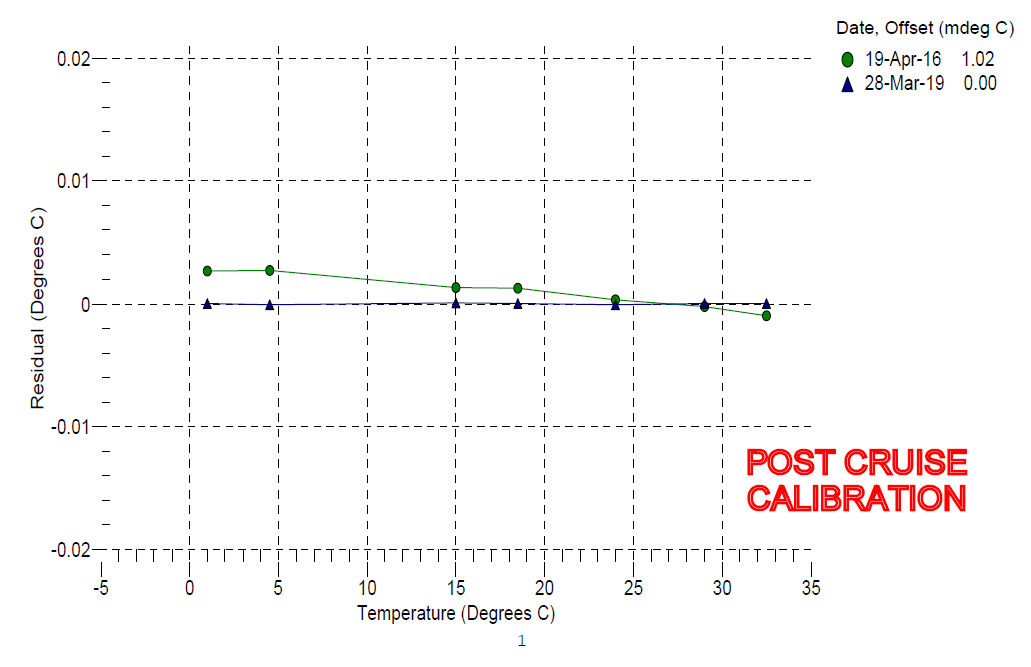
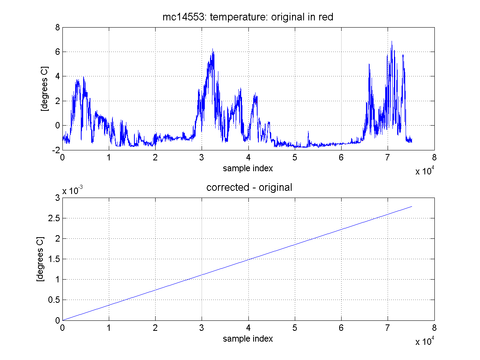
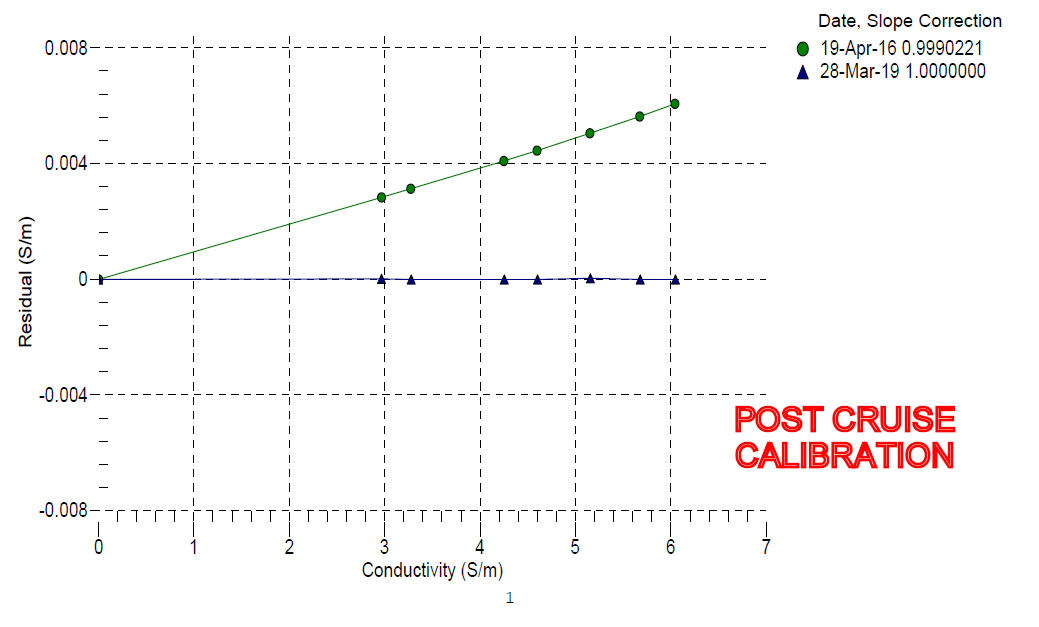
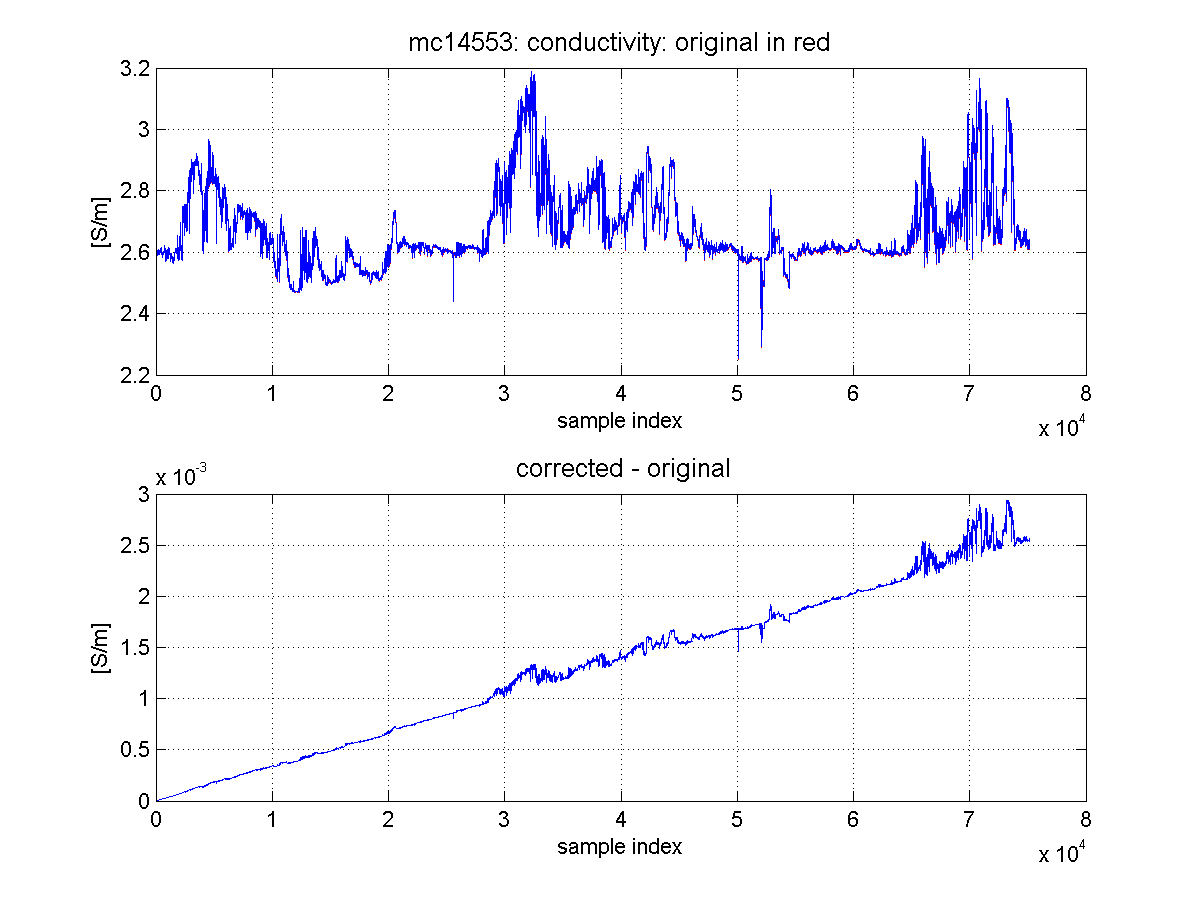
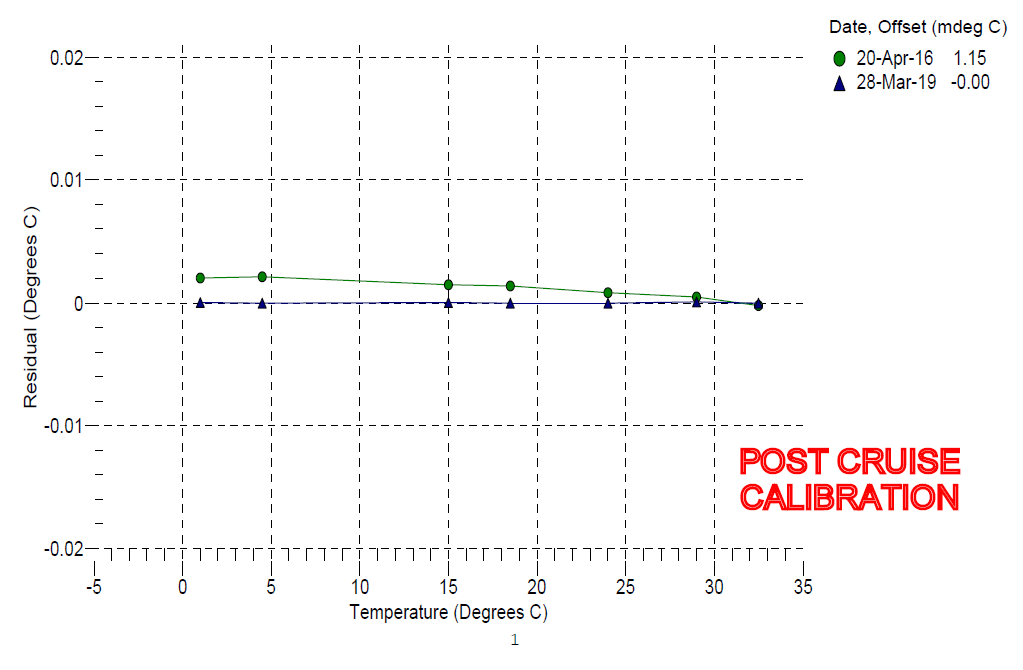
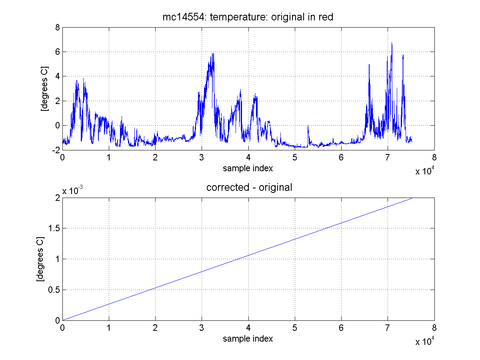
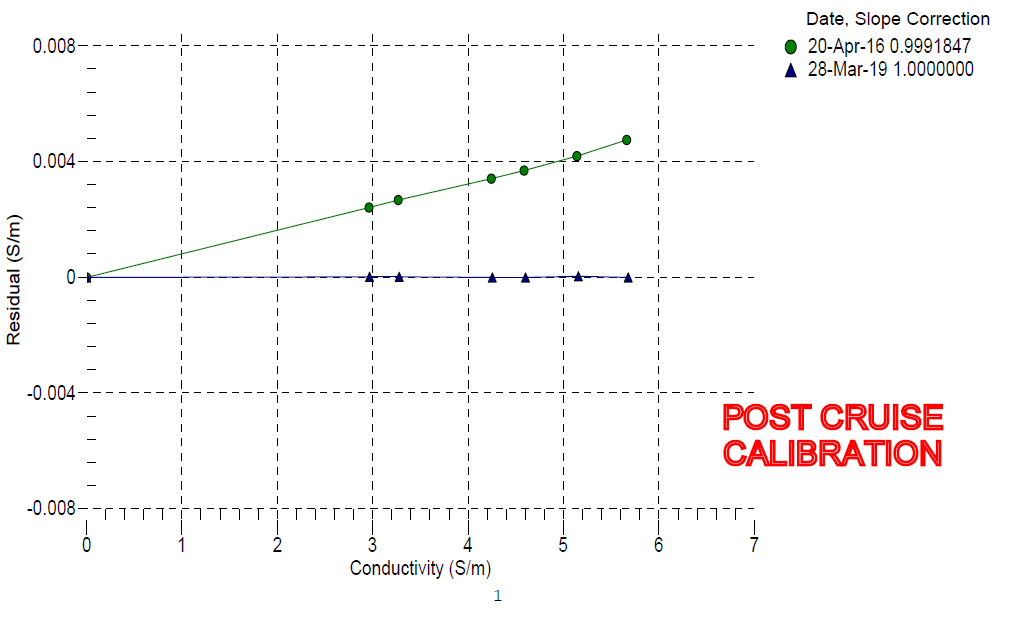
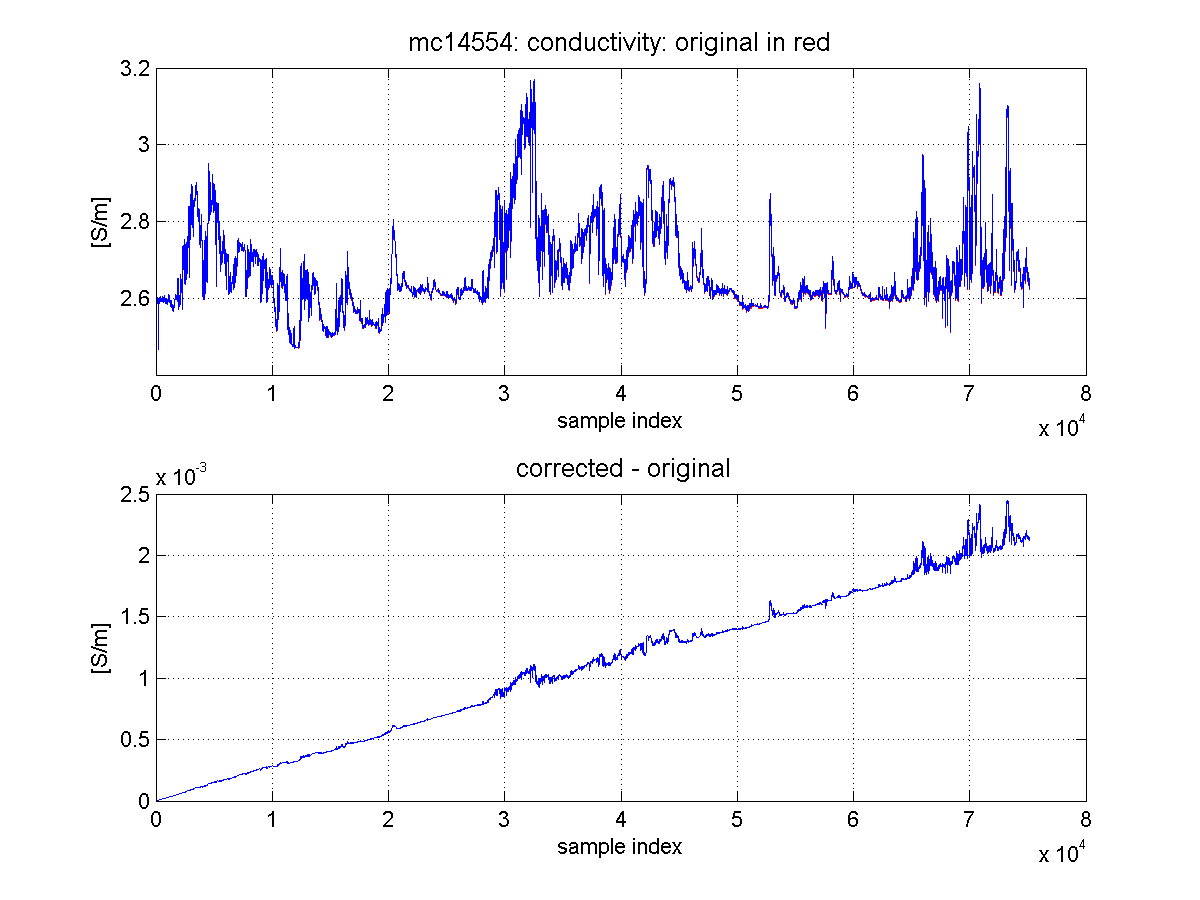
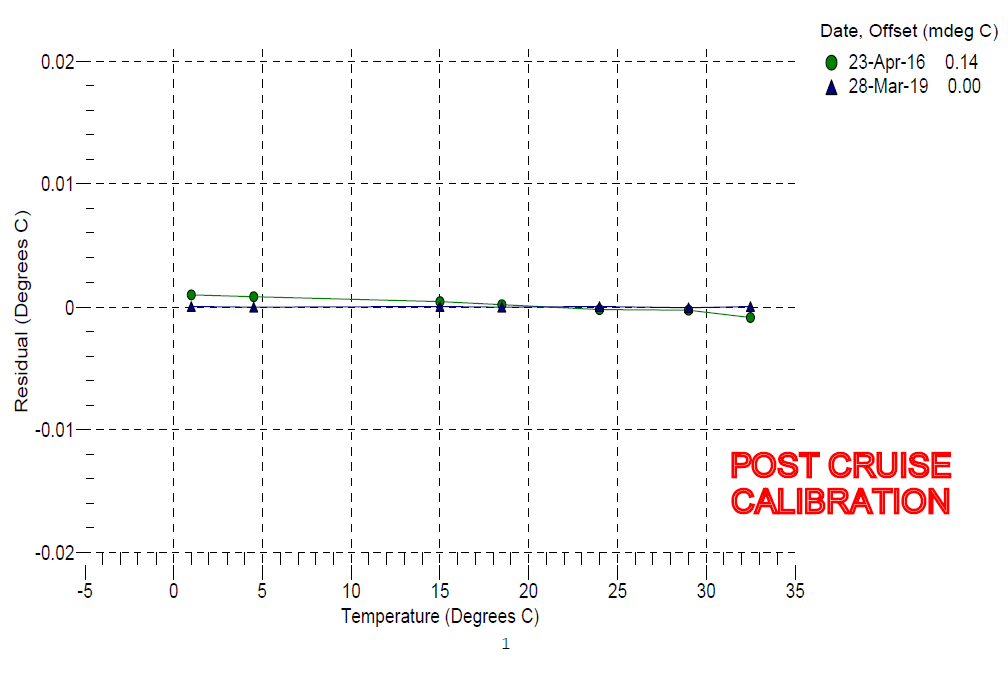
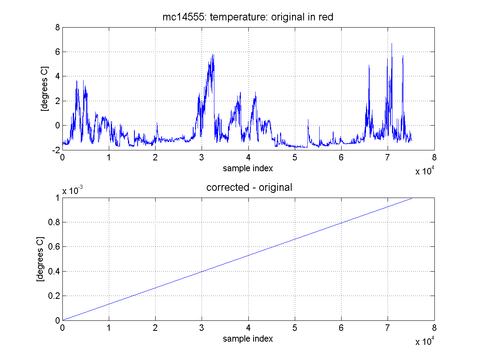
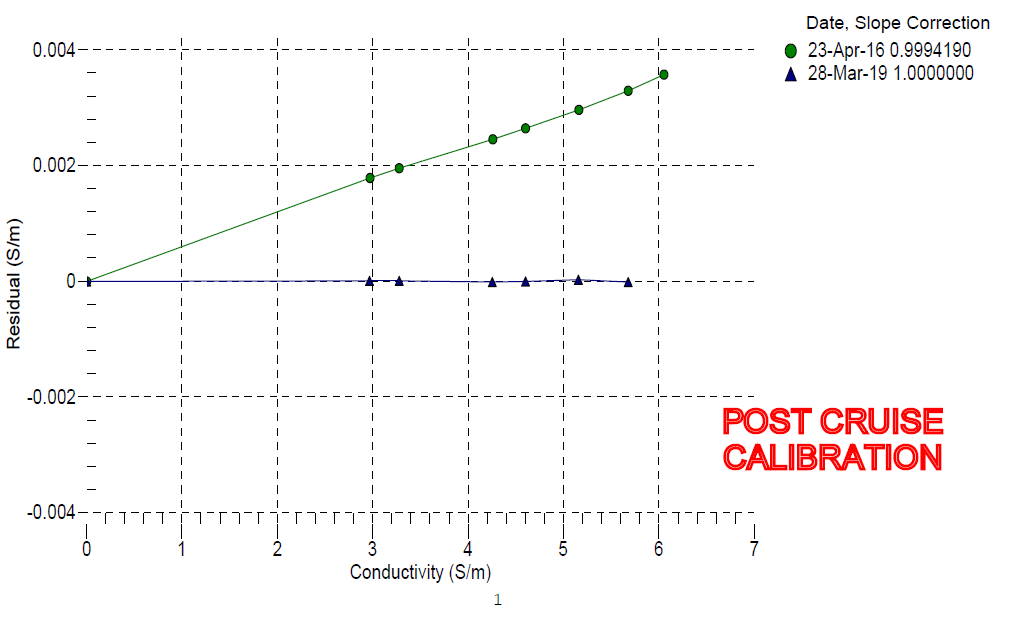
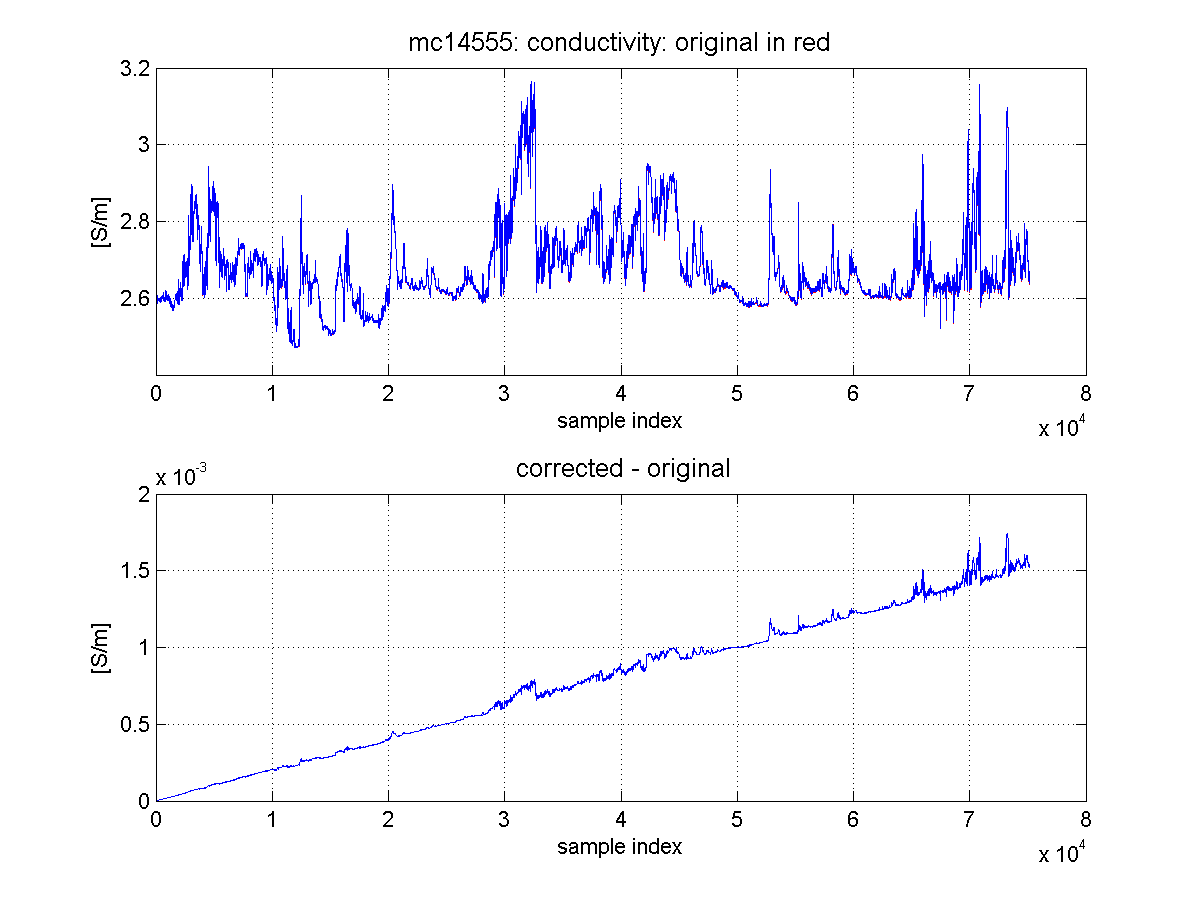
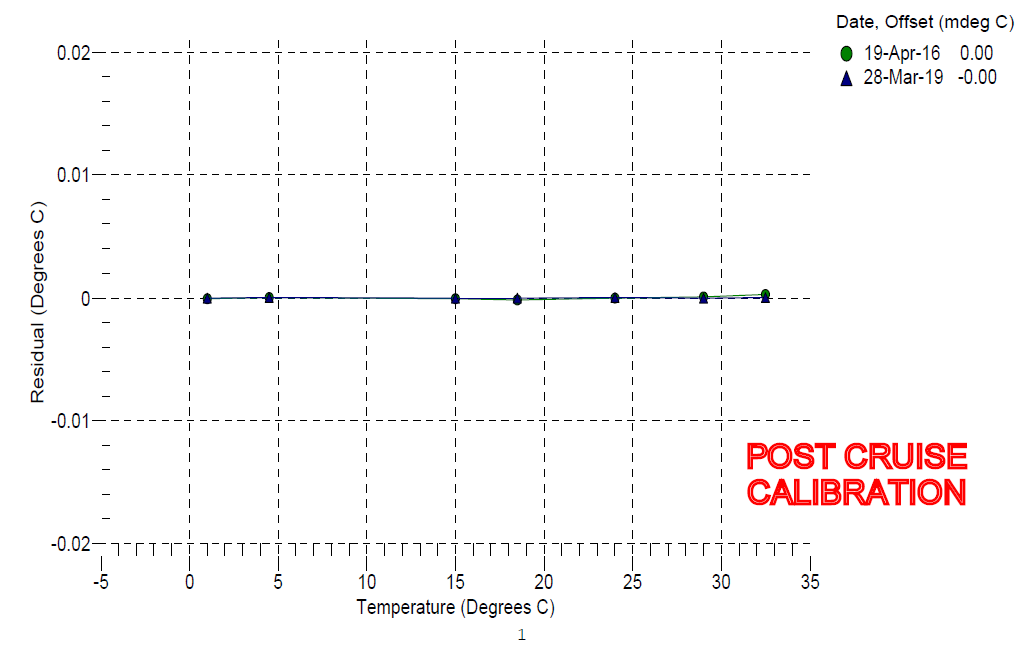
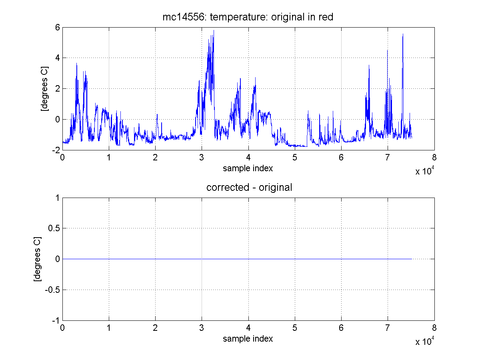
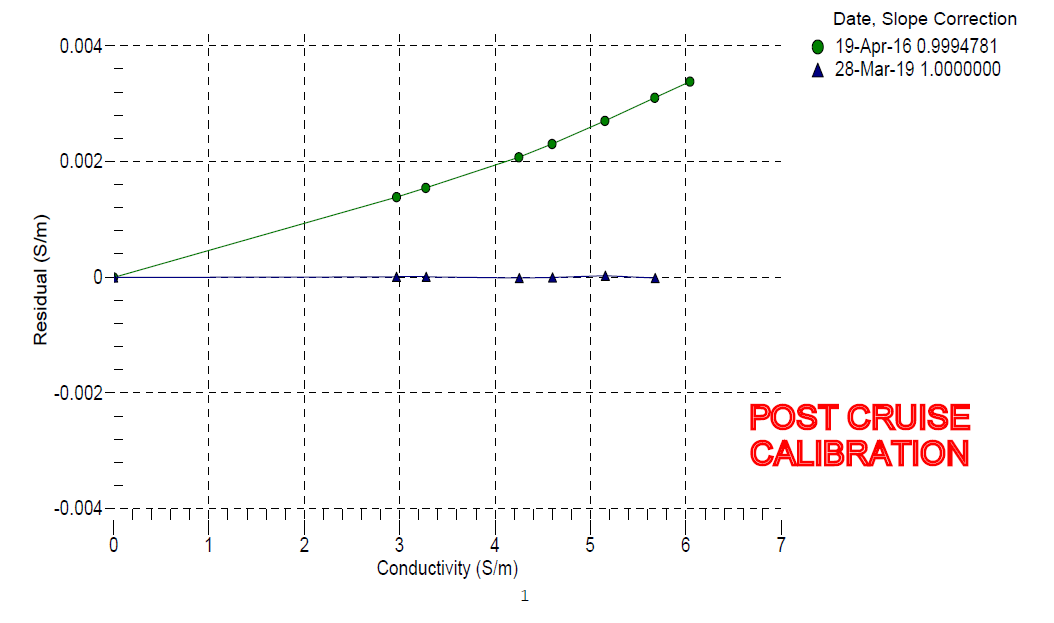
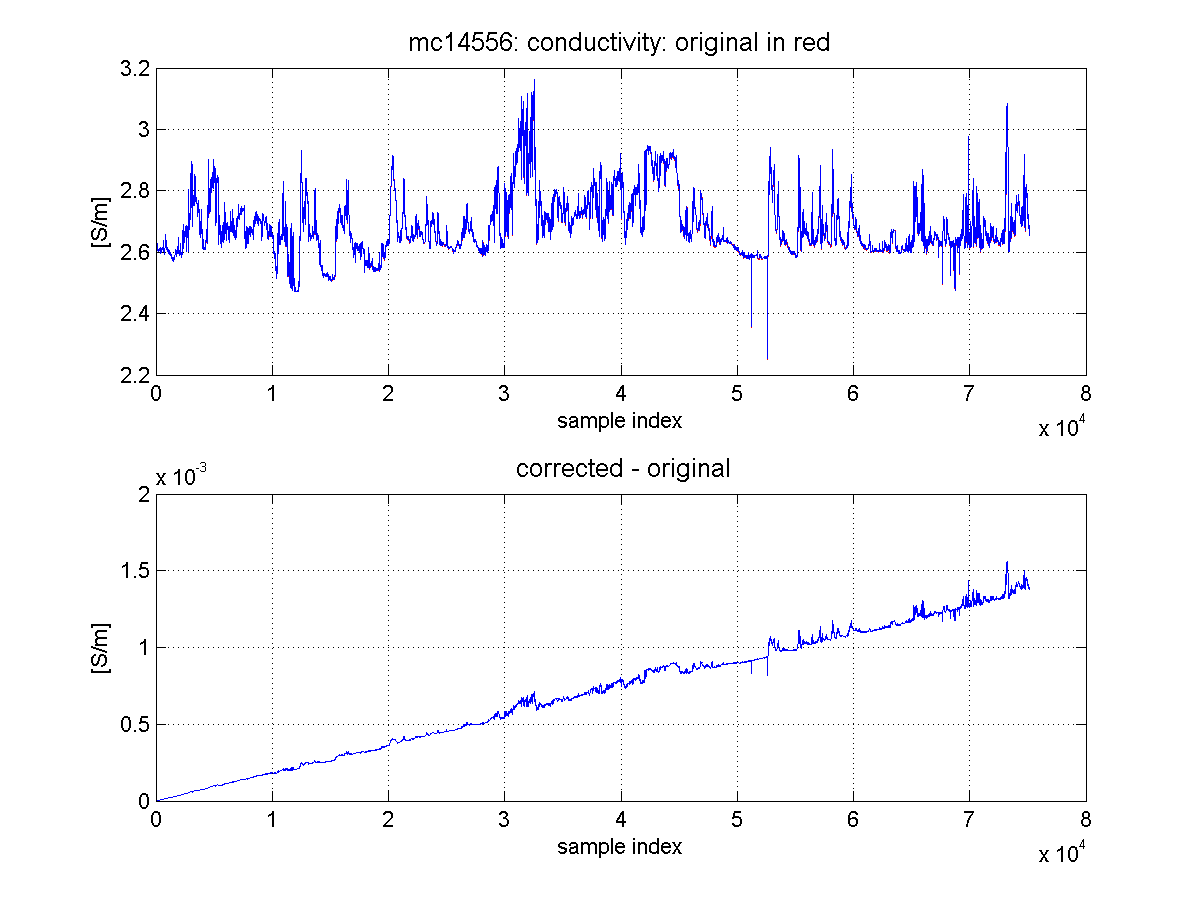
The calibration adjustments were based on the drift determined from the laboratory calibrations at SeaBird before and after the deployment. The SeaBird sheets, while very helpful, can be confusing at first sight (they have confused me in the past). Below, the adjustment process is described for the example of microcat #2139. It is followed by a summary table with the parameters for all eight microcats, and the SeaBird calibration figures. Temperature: The plot below shows the lower portion of the SeaBird calibration sheet for the March/April 2019 post-cruise calibration, a graphical display of the residuals from the current and the most recent previous calibration. When comparing calibrations from different times, the SeaBird sheets use the current (2019) coefficients to convert current instrument and bath readings (the triangles close to the zero line) as well as the earlier instrument and bath readings (circles). This general guide was described by SeaBird's Mark Baumann in an email from June 2000: "In general all comparisons on the cal sheet, be it temperature or conductivity are done using the coefficients for the calibration date that the coefficients are calculated for (the date at the upper left corner of the cal sheet) and the sensor outputs from the other calibrations (the dates to the right of the residual plot)." Residuals are defined as instrument temperature minus bath temperature. 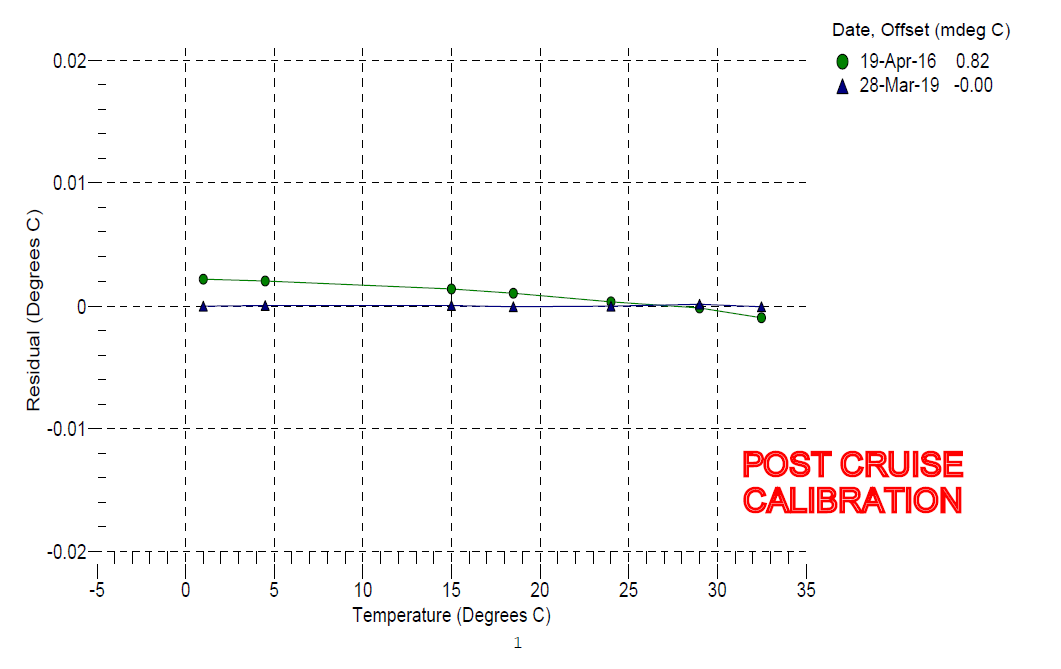 The figure indicates a small drift of about 0.002 degrees C over the range of values encountered during deployment (0 to 7 deg C). The cell has drifted [very slightly] "low" : using the 2016 instrument readings with the 2019 cal, instrument temperature was larger (residuals positive) than bath temperature. This implies that converting sensor frequencies collected in 2019 into temperatures using the 2016 cal generates instrument readings that are too low. A simple example: Lets say: temperature = cal * sensor frequency, a simplified conversion relation; - the 2019 sensor frequency = 5; bath temp = 10; => 2019 cal = 2; - we know: 2016 frequencies and 2019 cal generated positive residuals, i.e., higher temps; lets say 15 degrees; => 2016 frequency was 7.5; - back in 2016, a frequency of 7.5 gave the correct bath temp of 10, so the 2016 cal was 1.33. - in 2019, when the sensor frequency was 5, applying the 2016 cal gives only 6.67 degrees => we have to increase the temps calculated by converting frequencies measured with the 2016 cal. Since we are using the 2016 cal (i.e., the T values downloaded from the instrument after recovery), we need to add 0.002 deg C at the end of the deployment. Lacking additional information, we assume the drift occurred linearly in time over the course of the deployment, from no correction at the start to full correction at the end of the record. 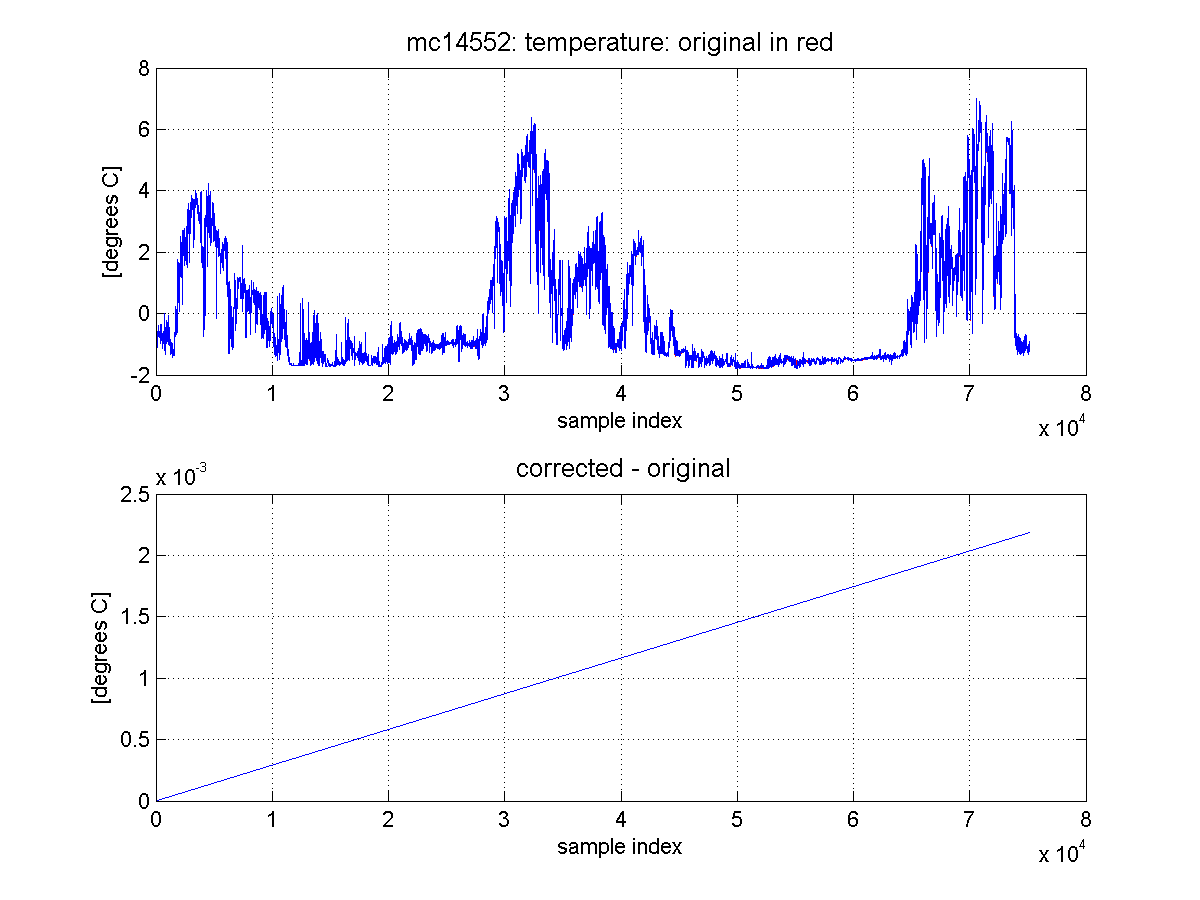 Conductivity: The conductivity correction followed a similar scheme. Again, the sensor had drifted "low", leading to positive residuals on the cal sheet. So conductivity of the downloaded data was increased in time, again going linearly from no to full correction over the course of the record. In contrast to temperature, however, the correction itself was a linear funtion of conductivity ("slope correction"). The reason is that the origin (zero output at zero conductivity) has been found to be very stable. |
 |
 |
|
|
 |
 |
 |
 |
 |
 |
|
|
 |
 |
 |
 |
| |
 |
 |
 |
 |
 |
 |
 |
 |
 |
 |
 |
 |
 |
 |
 |
 |
 |
 |
 |
|
|