

Deployment 2009 to 2010:
LR75 ADCP
LR75 ADCP
|
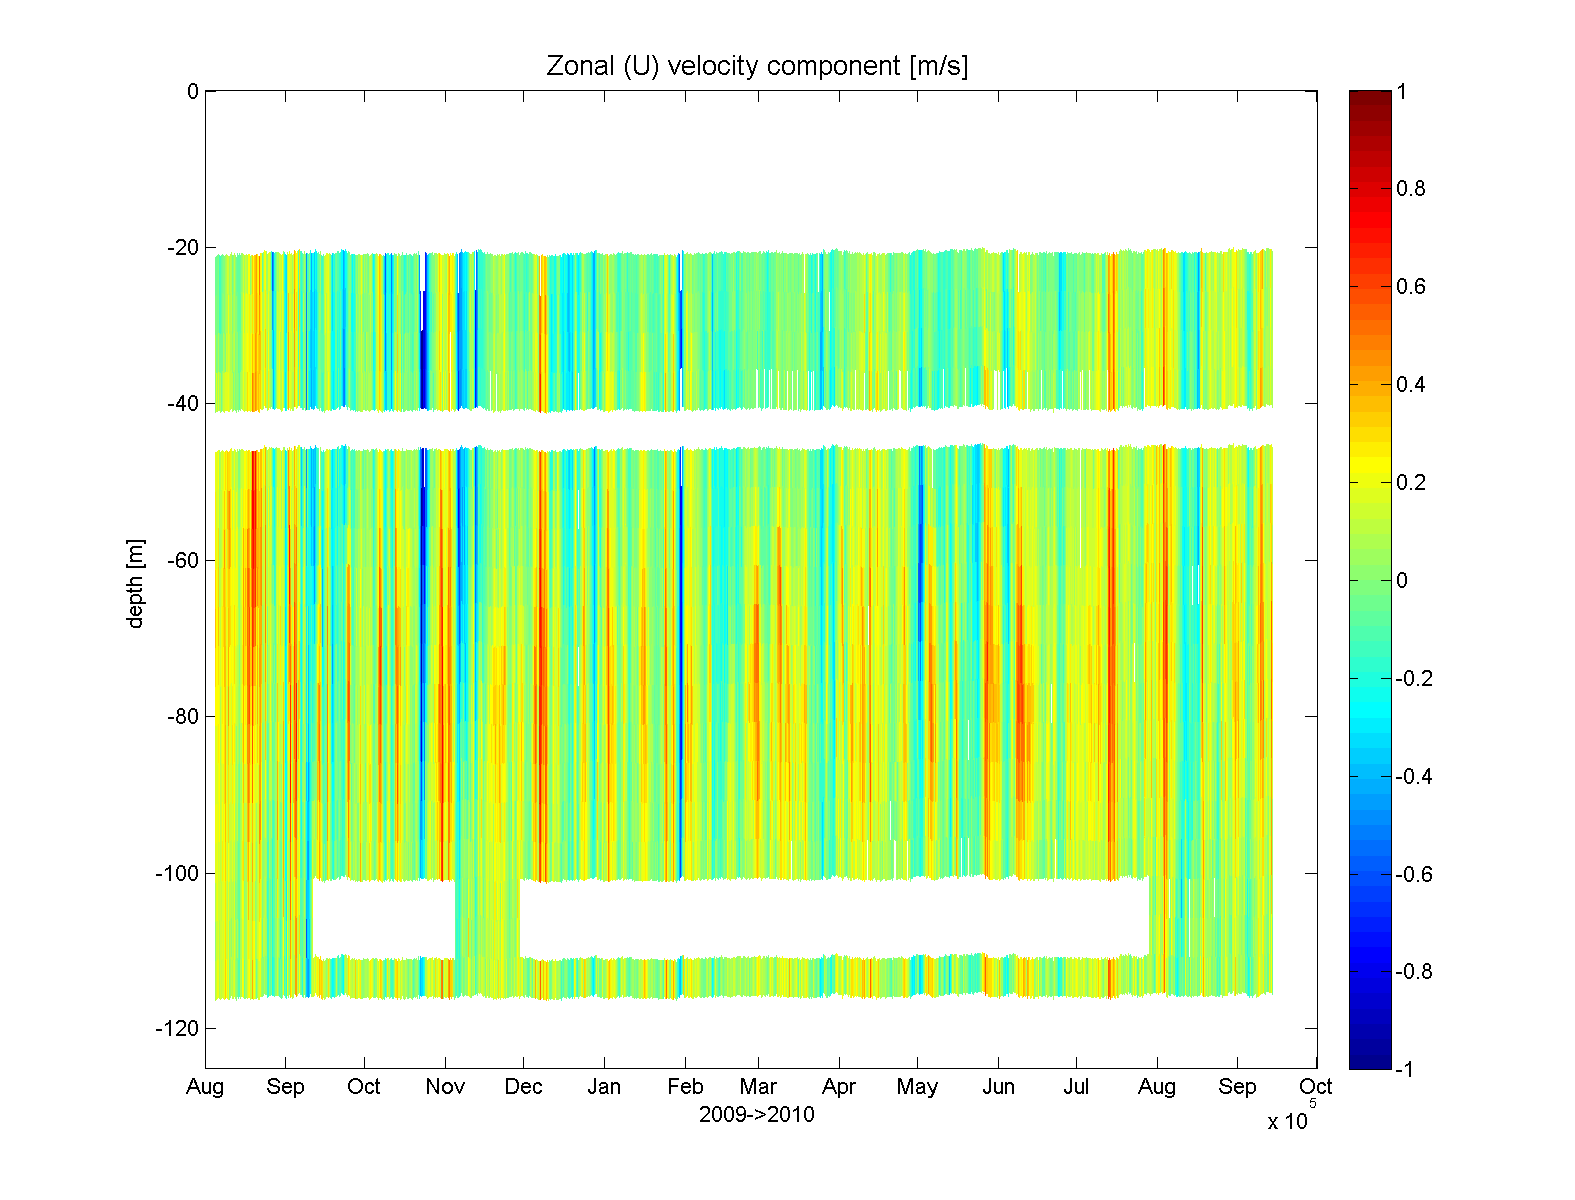
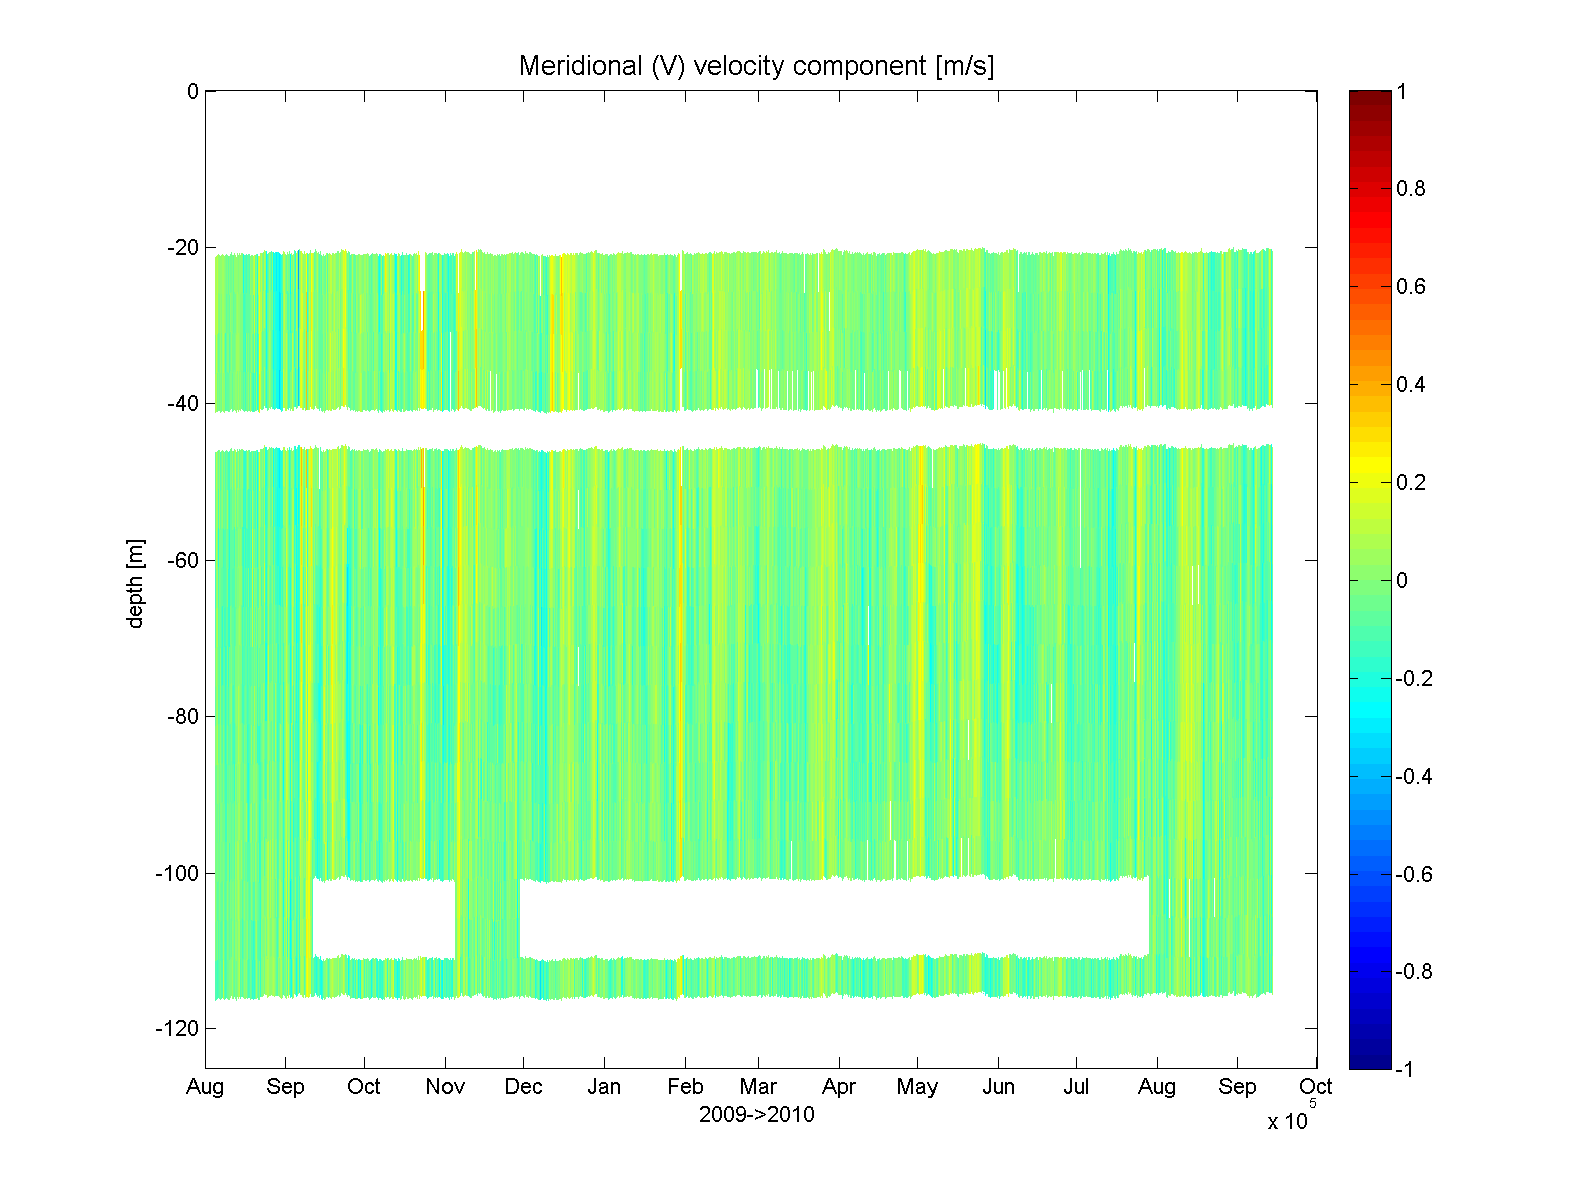
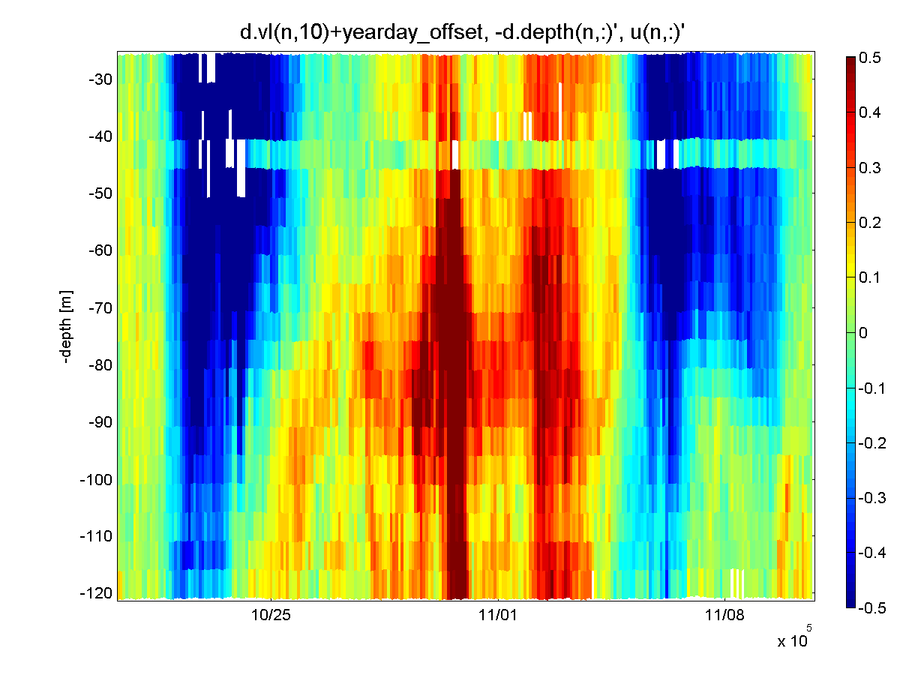
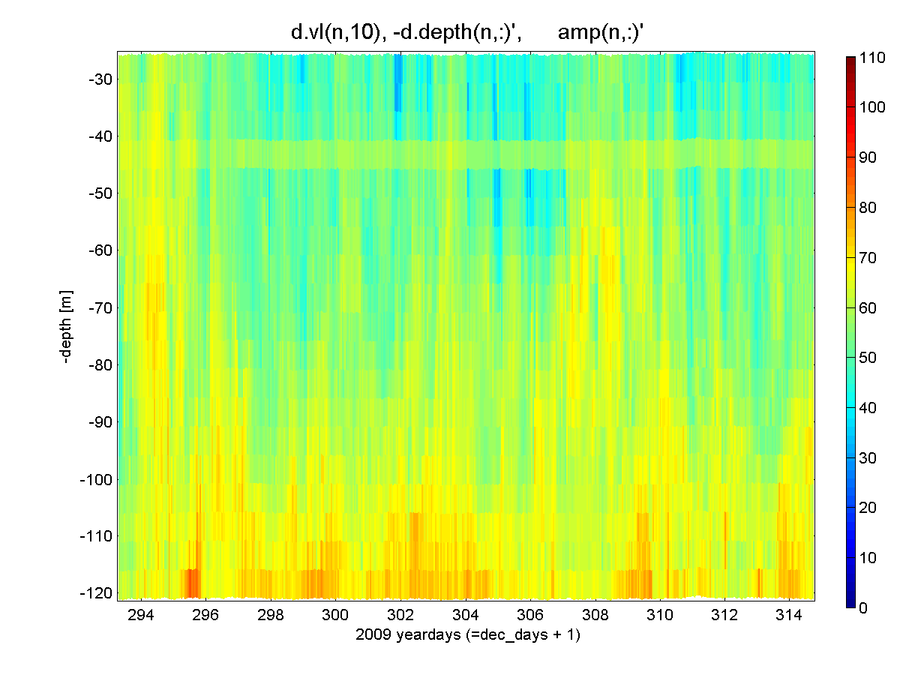
Deployment summary: Duration: Aug 5, 2009 to Set 15, 2010 Location: BS3 mooring site Variables measured:zonal, meridional velocity Sensor information: 75KHz LongRanger by RDInstruments . Processed data: contained in the matlab file aon10_bs3b_Final1.mat the data format is described in data_format.txt . Data processing: The data were processed with matlab routines provided by D. Torres, modified and augmented by F. Bahr. Following the conversion from RDI's binary format into matlab, the data was rotated to correct for magnetic compass declination. Pre- and post-deployment data collected in air or during the mooring launch/recovery were eliminated. ADCP temperature and/or pressure records were compared with the nearby microcat to check for gross clock errors. Thresholds were determined for automatic outlier screening based on error velocity and percent_good (typically 0.05 m/s and 30, respectively). Additional manual editing was based on visual inspection of pcolor plots of 20-day subsets. For this dataset, this included a small set of near-surface bins (listed in the file "add_flag_fb.asc"). Finally, conversion routines re-structured the data into the format described in the file data_format.txt linked to under "Processed data". Special considerations for this dataset include: - due to operator error, bin size was set to 5m for this deployment instead of our typical LR75 setting of 10m bins. It appeared to have caused no harm. - the same error lead to a smaller than usual blanking interval (the distance from the transducer whithin which returns are ignored, to avoid transducer ringing). The first then ended up being too close to the transducer, and was edited out manually. - there were clear signs of beam interference from the mooring float, located near 40m depth. Horizontal velocity included outliers, and an increased number of drop-outs for bin 16. Backscatter amplitude was increased as well. I decided to wipe (mark as NaN) all zonal and meridional velocities for this bin. - for overall editing, it seemed sufficient to relax the error velocity threshold to 0.1 m/s here. - bins 3 and 4 showed an odd increase in backscatter amplitude. It did not appear to trigger fake velocities as much reduce the vertical velocity structure observed in the adjacent bins. A very similar affect was seen in the data from the 2008->2009 LR75 (a different ADCP, owned by Harper Simmons), which (by design) also collected 5-meter bins. There, presumably because of a larger blanking interval, it was bins 2 and 3 that showed a slight amplitude increase and a corresponding reduction in water velocity. The "disturbance" appeared to be stronger when overall signal strength was lower, as during the winter months with fewer backscatterers in the water column. I edited out bins 3 and 4 for most of the record, but left them unchanged for three short periods in the record that appeared unaffected. Details of the data processing can be found in my process notes for this dataset. Lastly: mostly for my own reference, I included a page showing the plots of 20-day time series subsests used during manual editing. They show the state of the data after all editing was applied. For additional documentation, the 20-day plots prior to editing out the bin 3,4 problem were included here as well. |
|
|