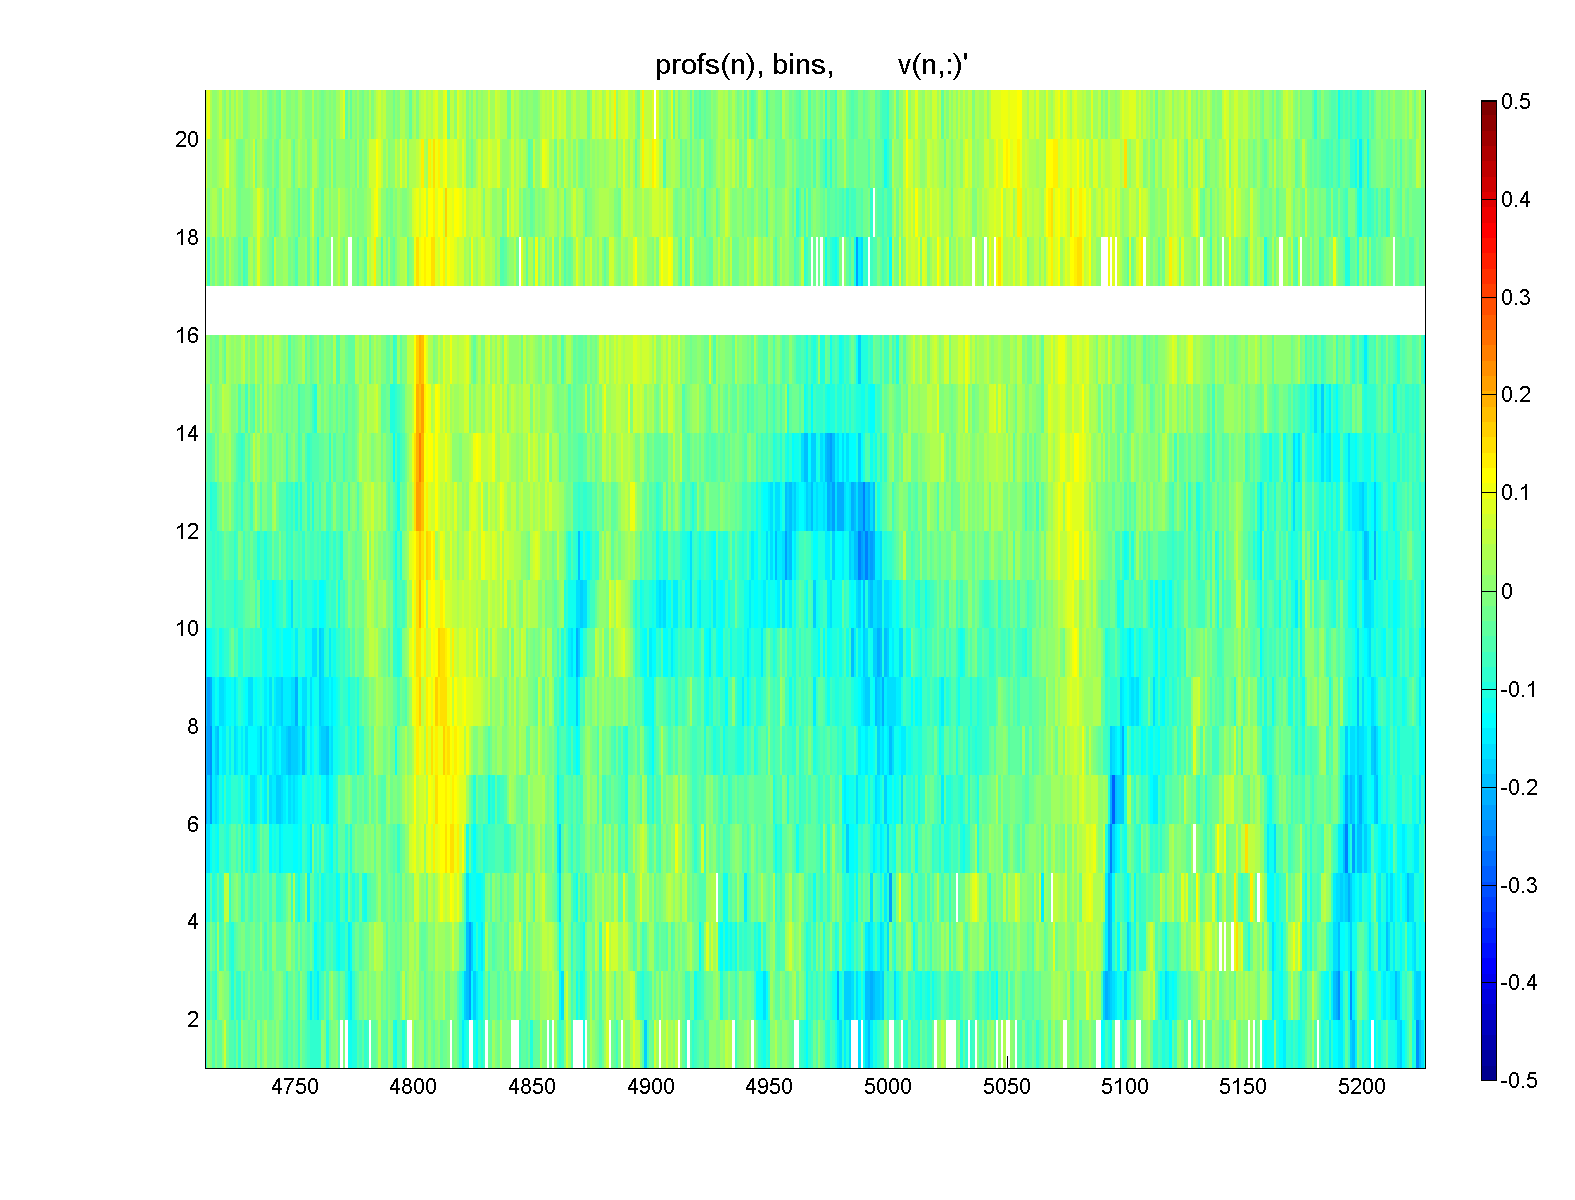
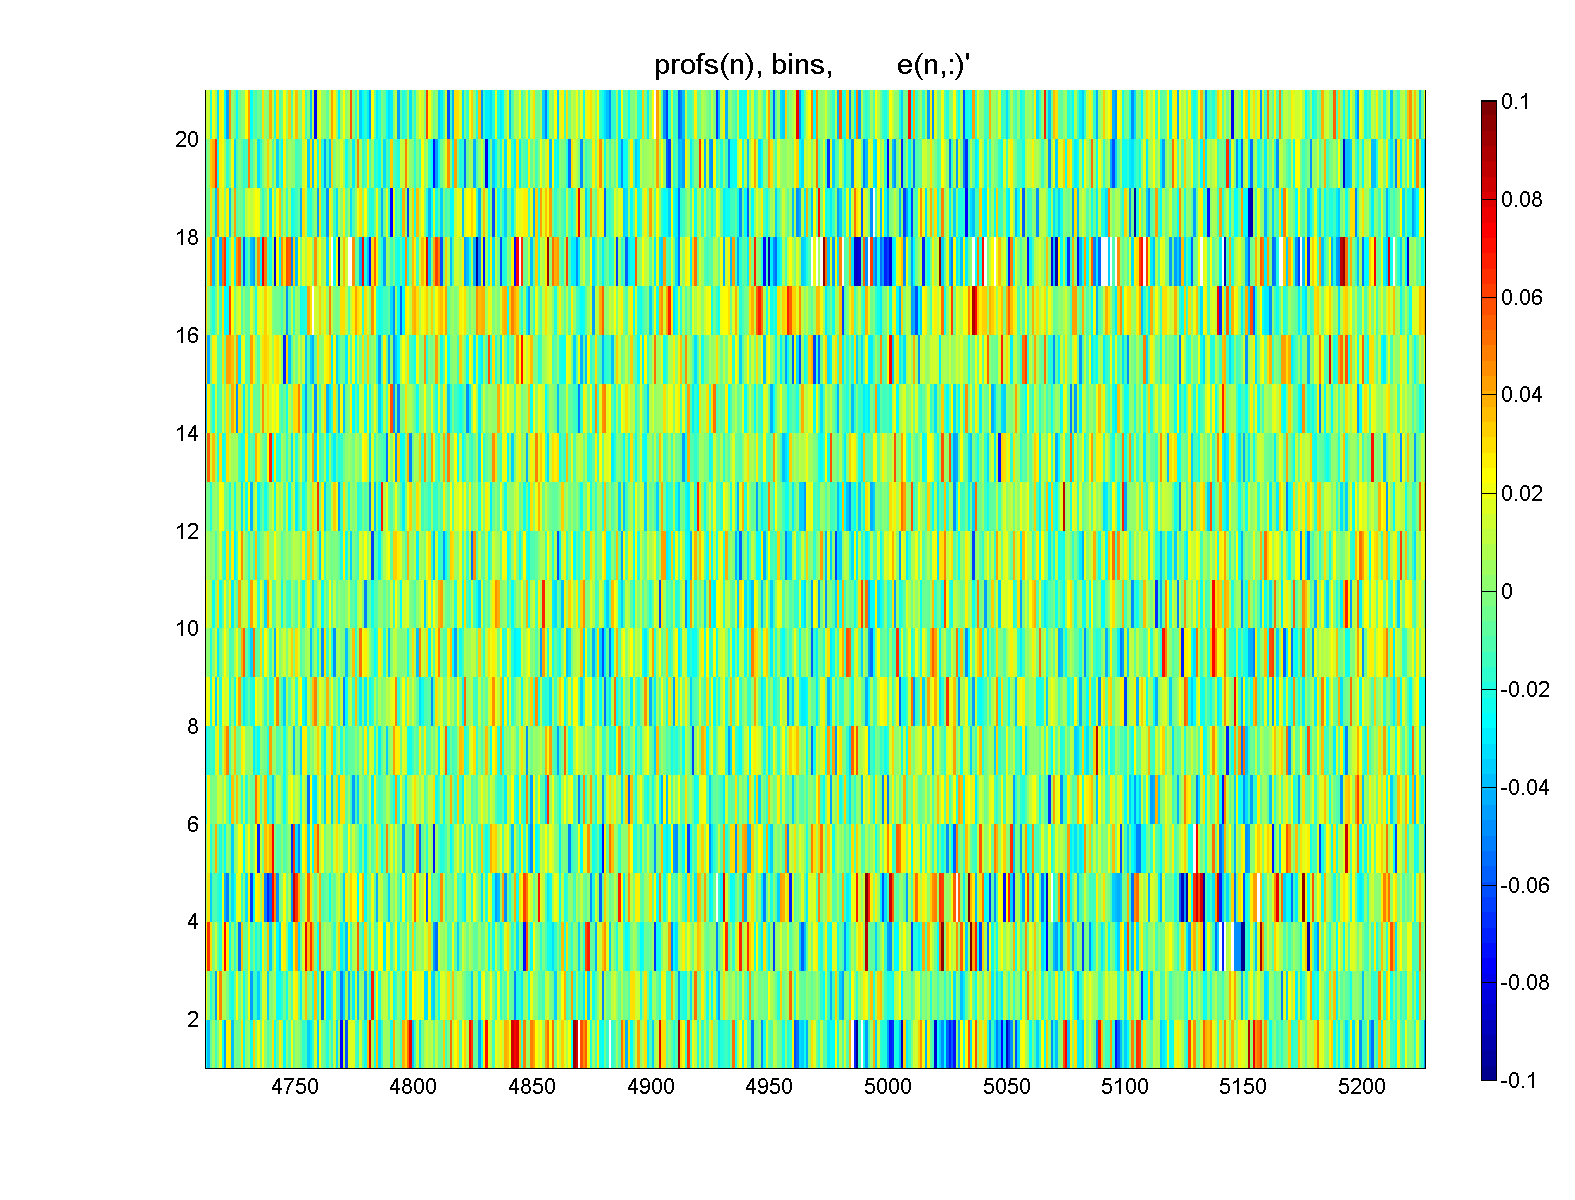
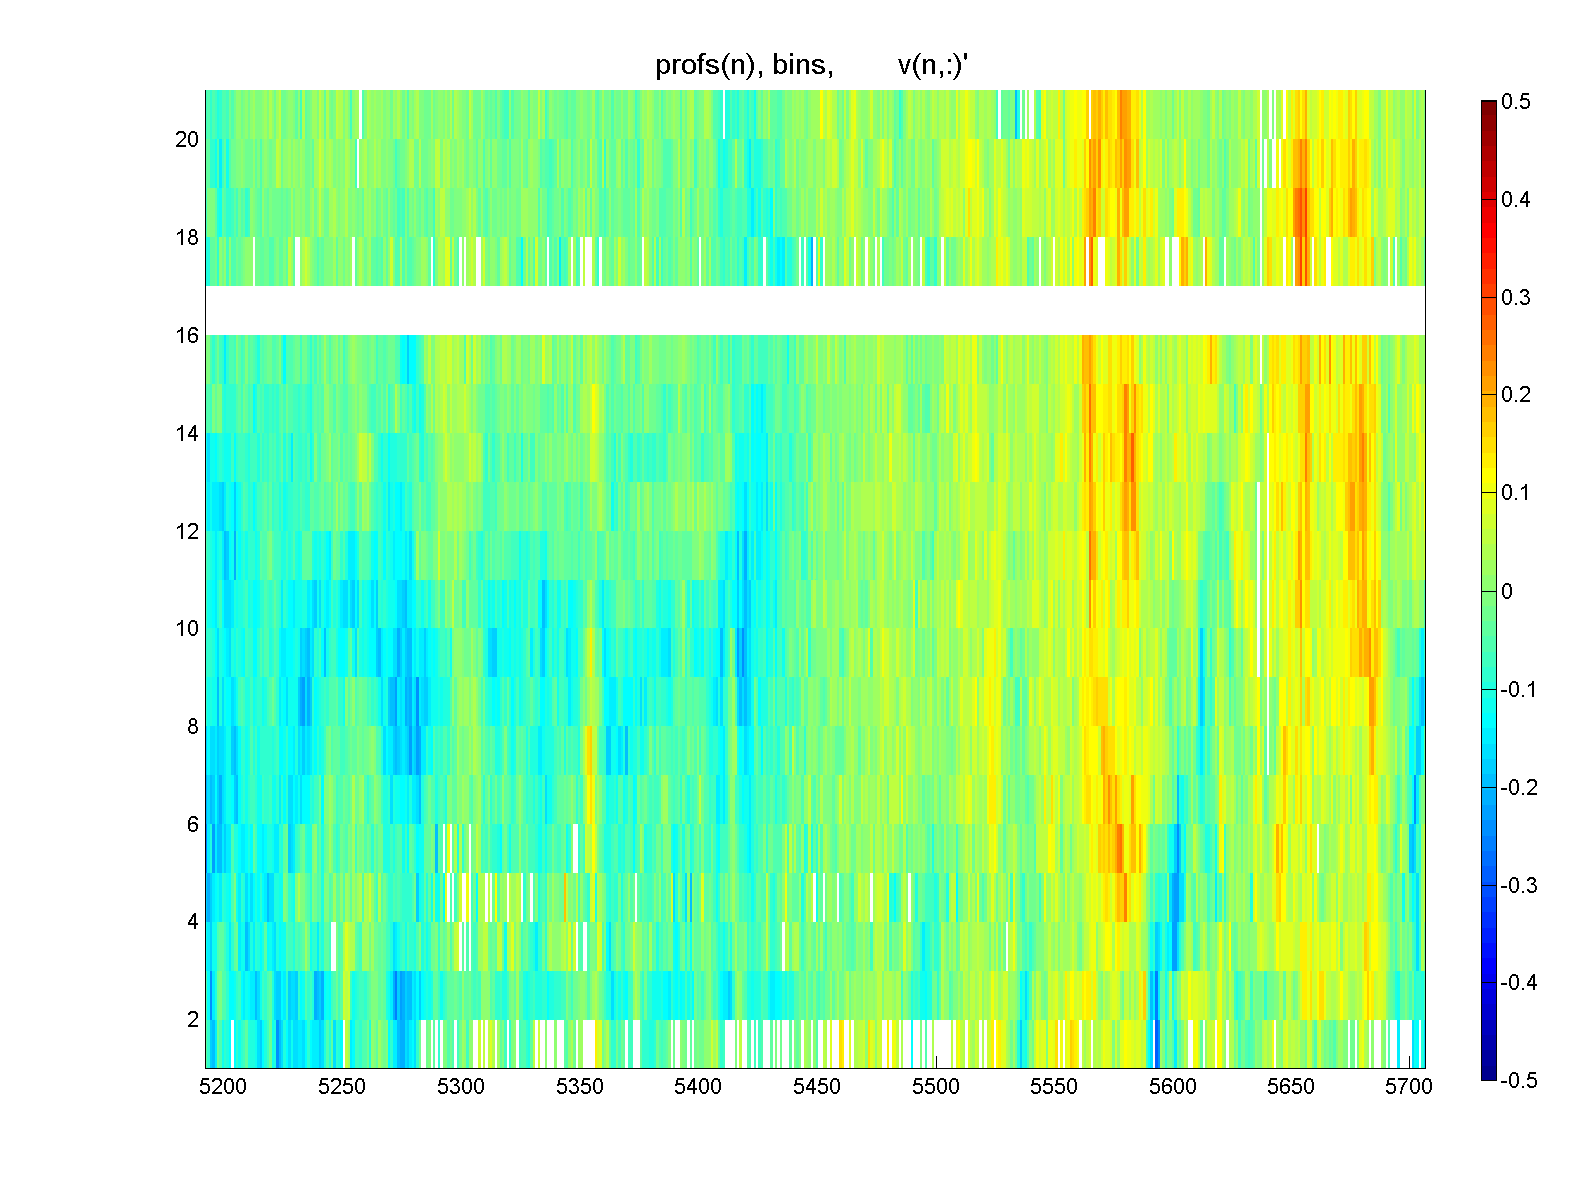
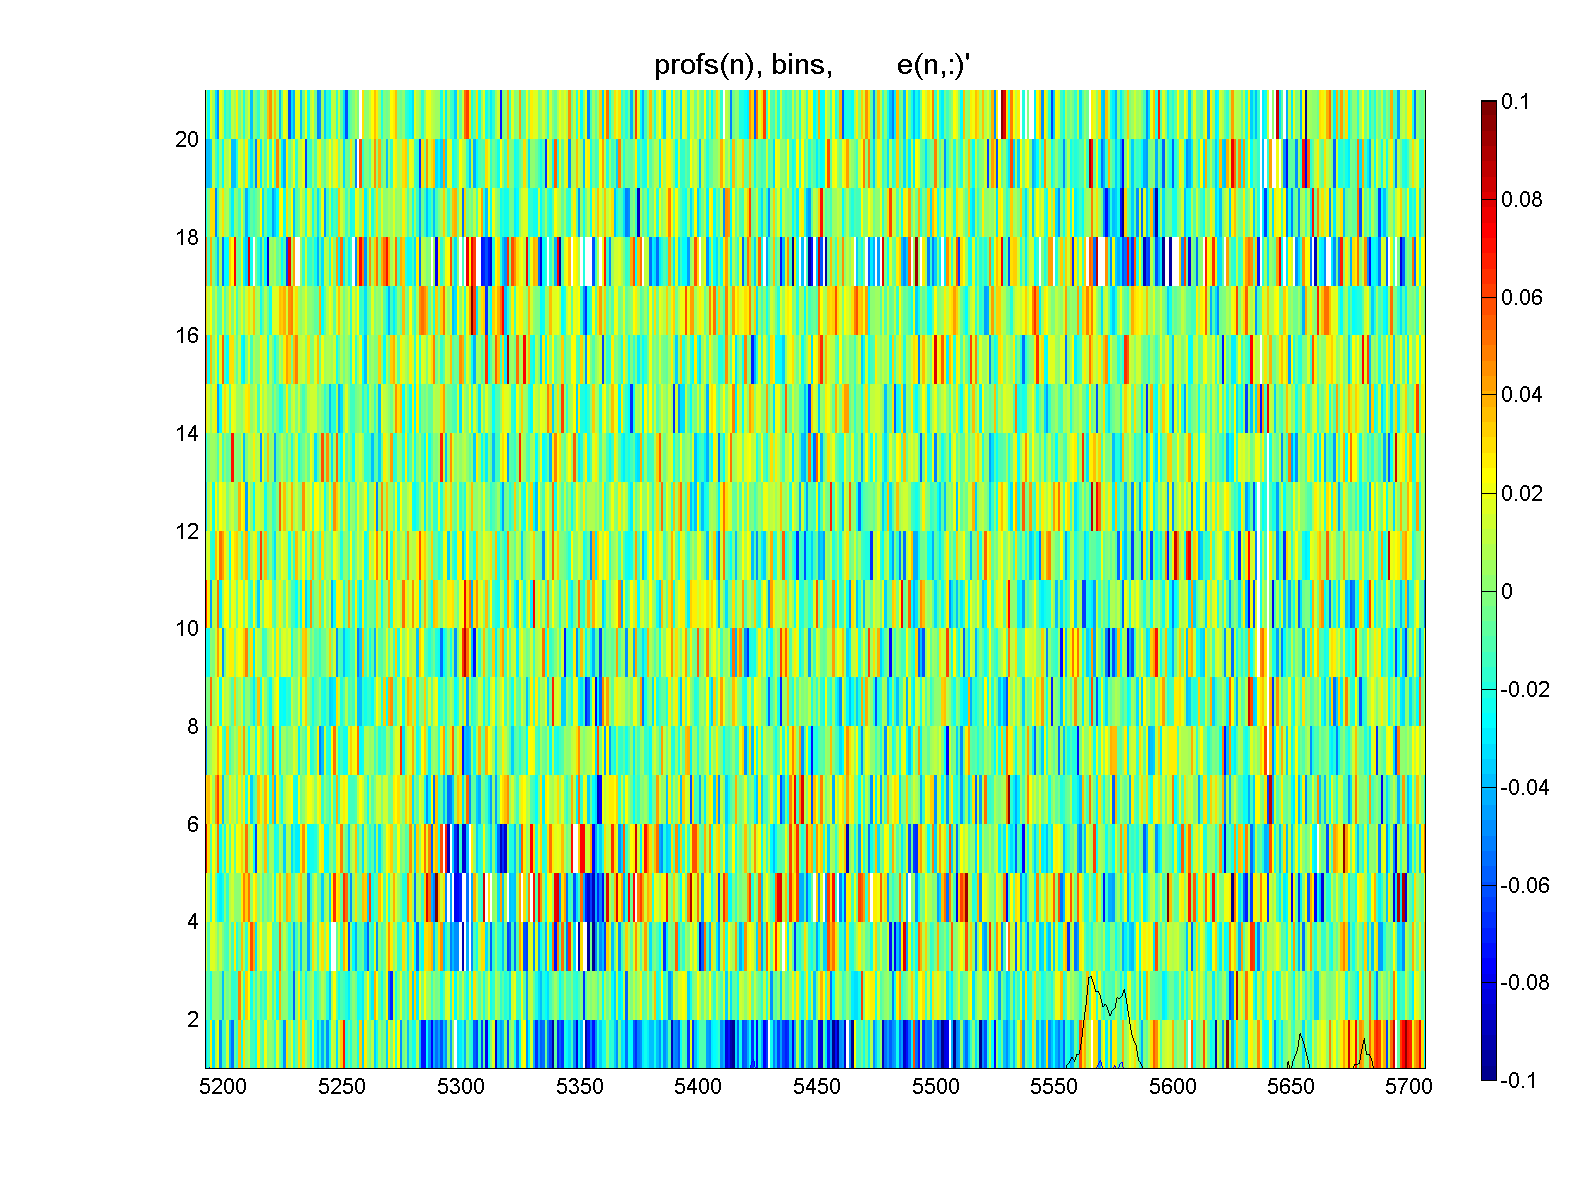
BS3 2009->2010 LR75:
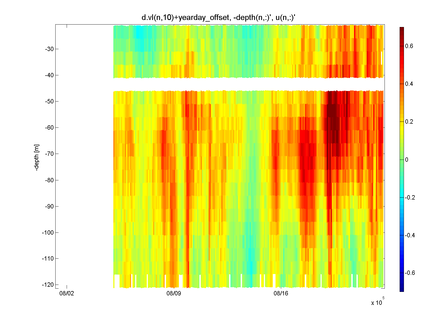
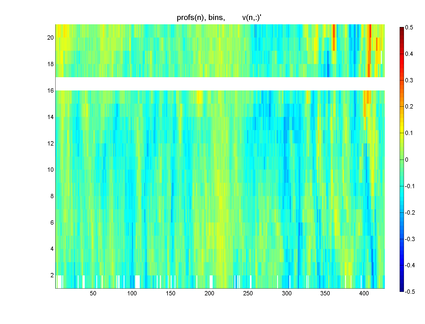
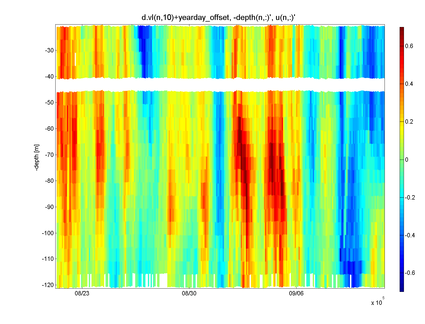
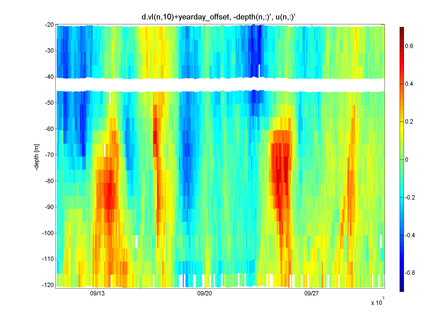
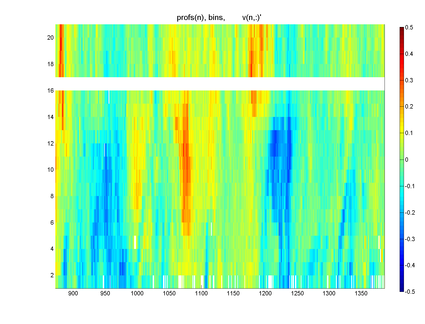
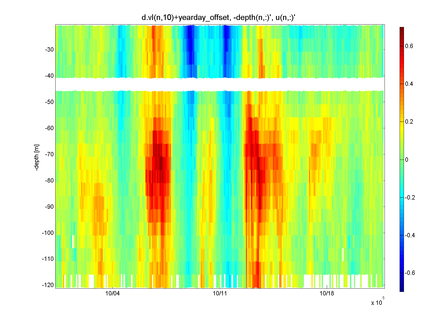
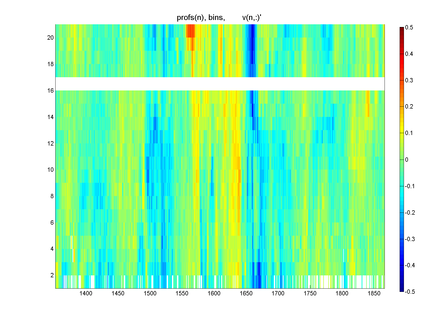
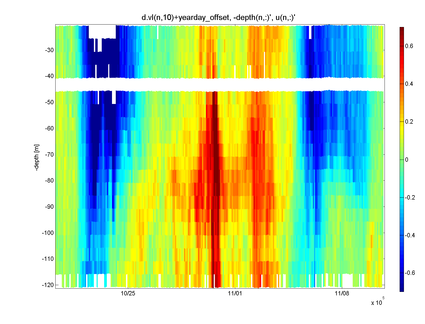
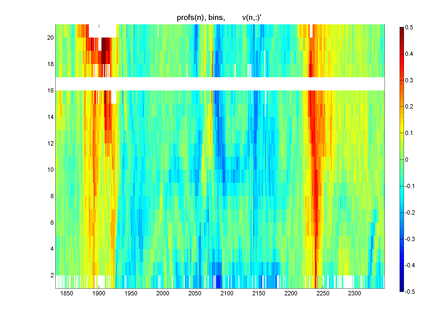
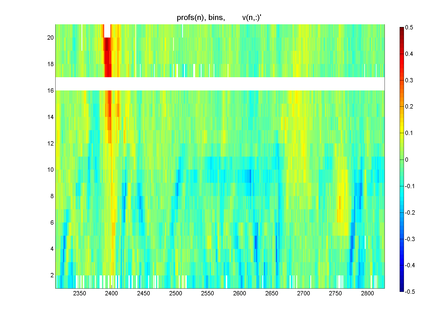
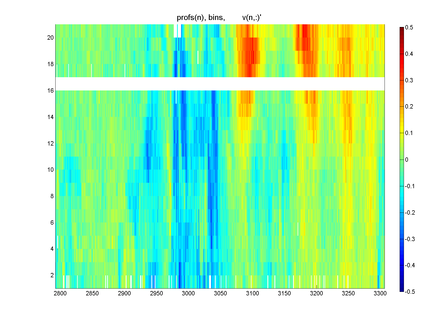
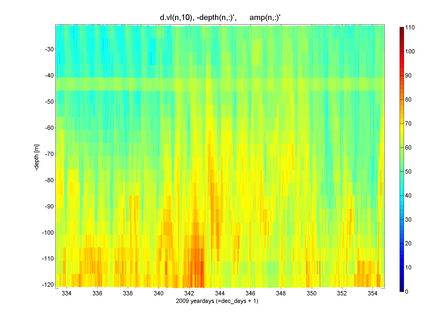
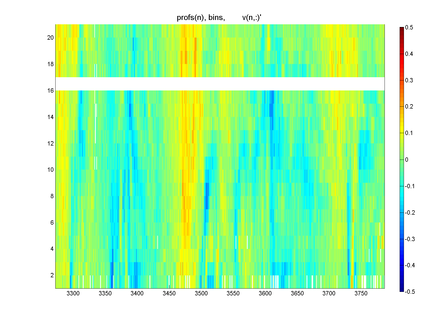
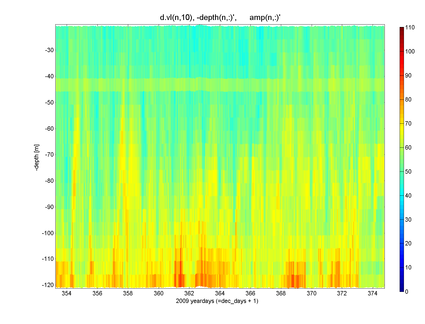
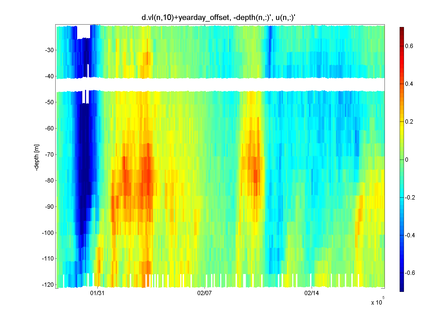
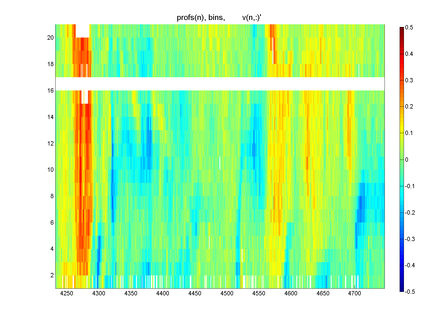
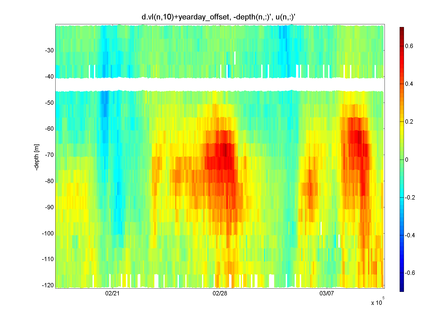
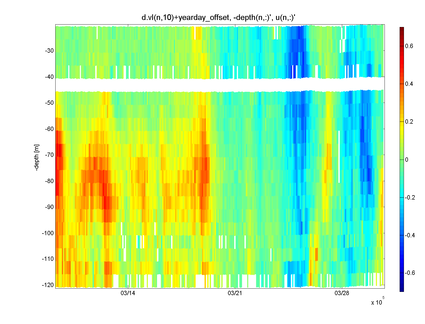
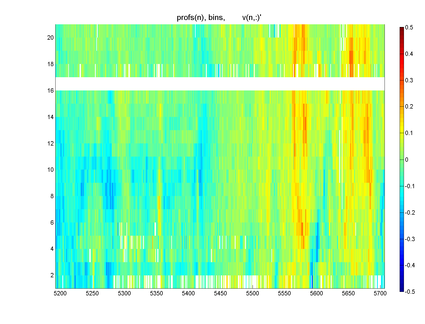
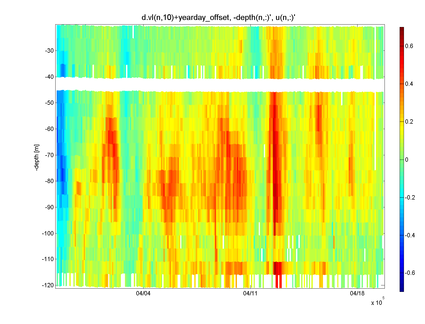
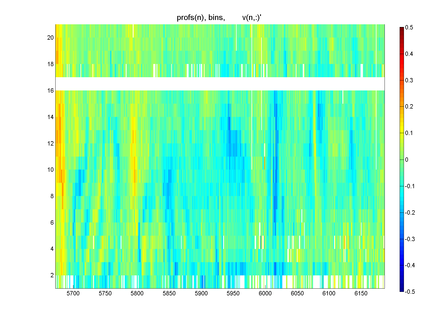
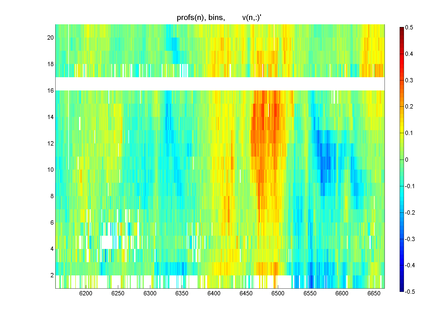
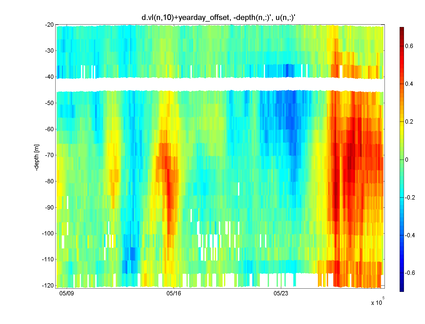
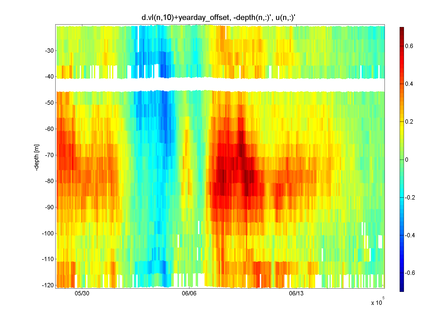
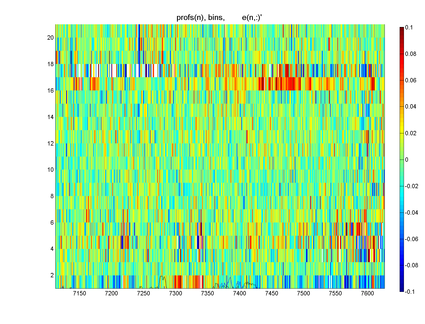
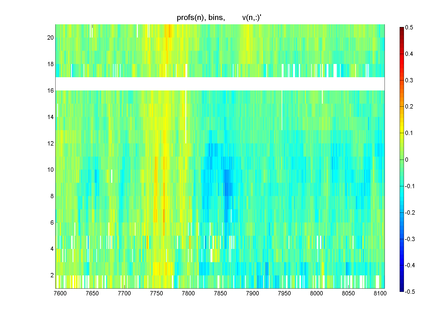
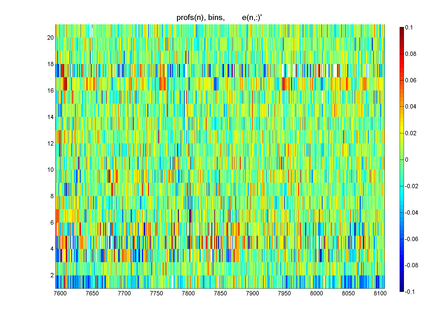
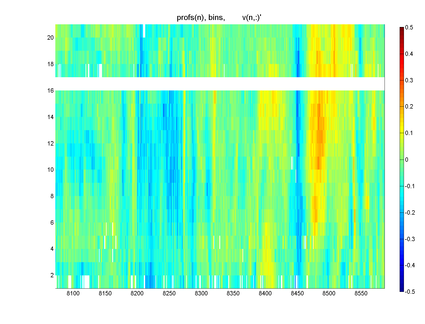
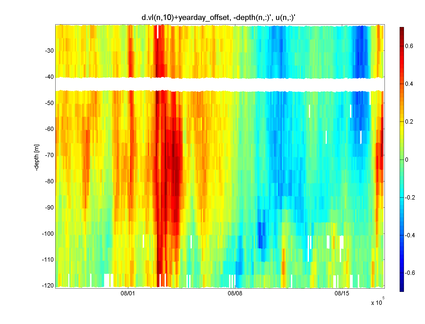
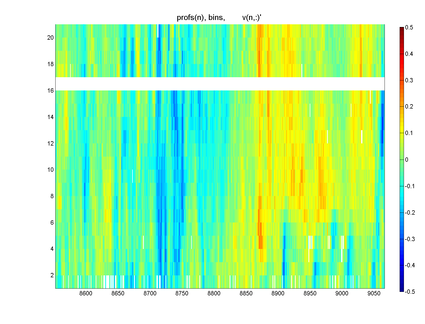
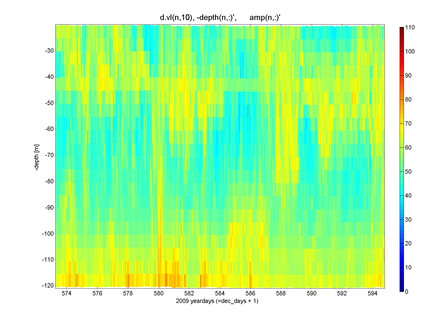
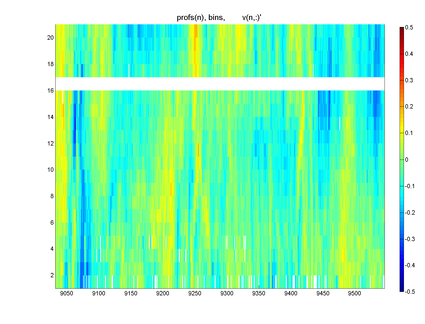
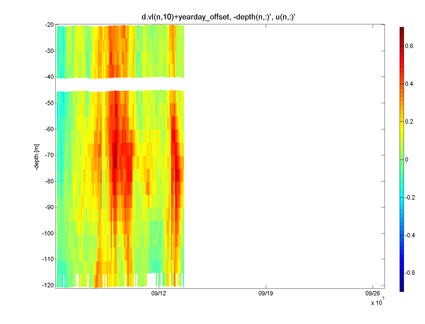
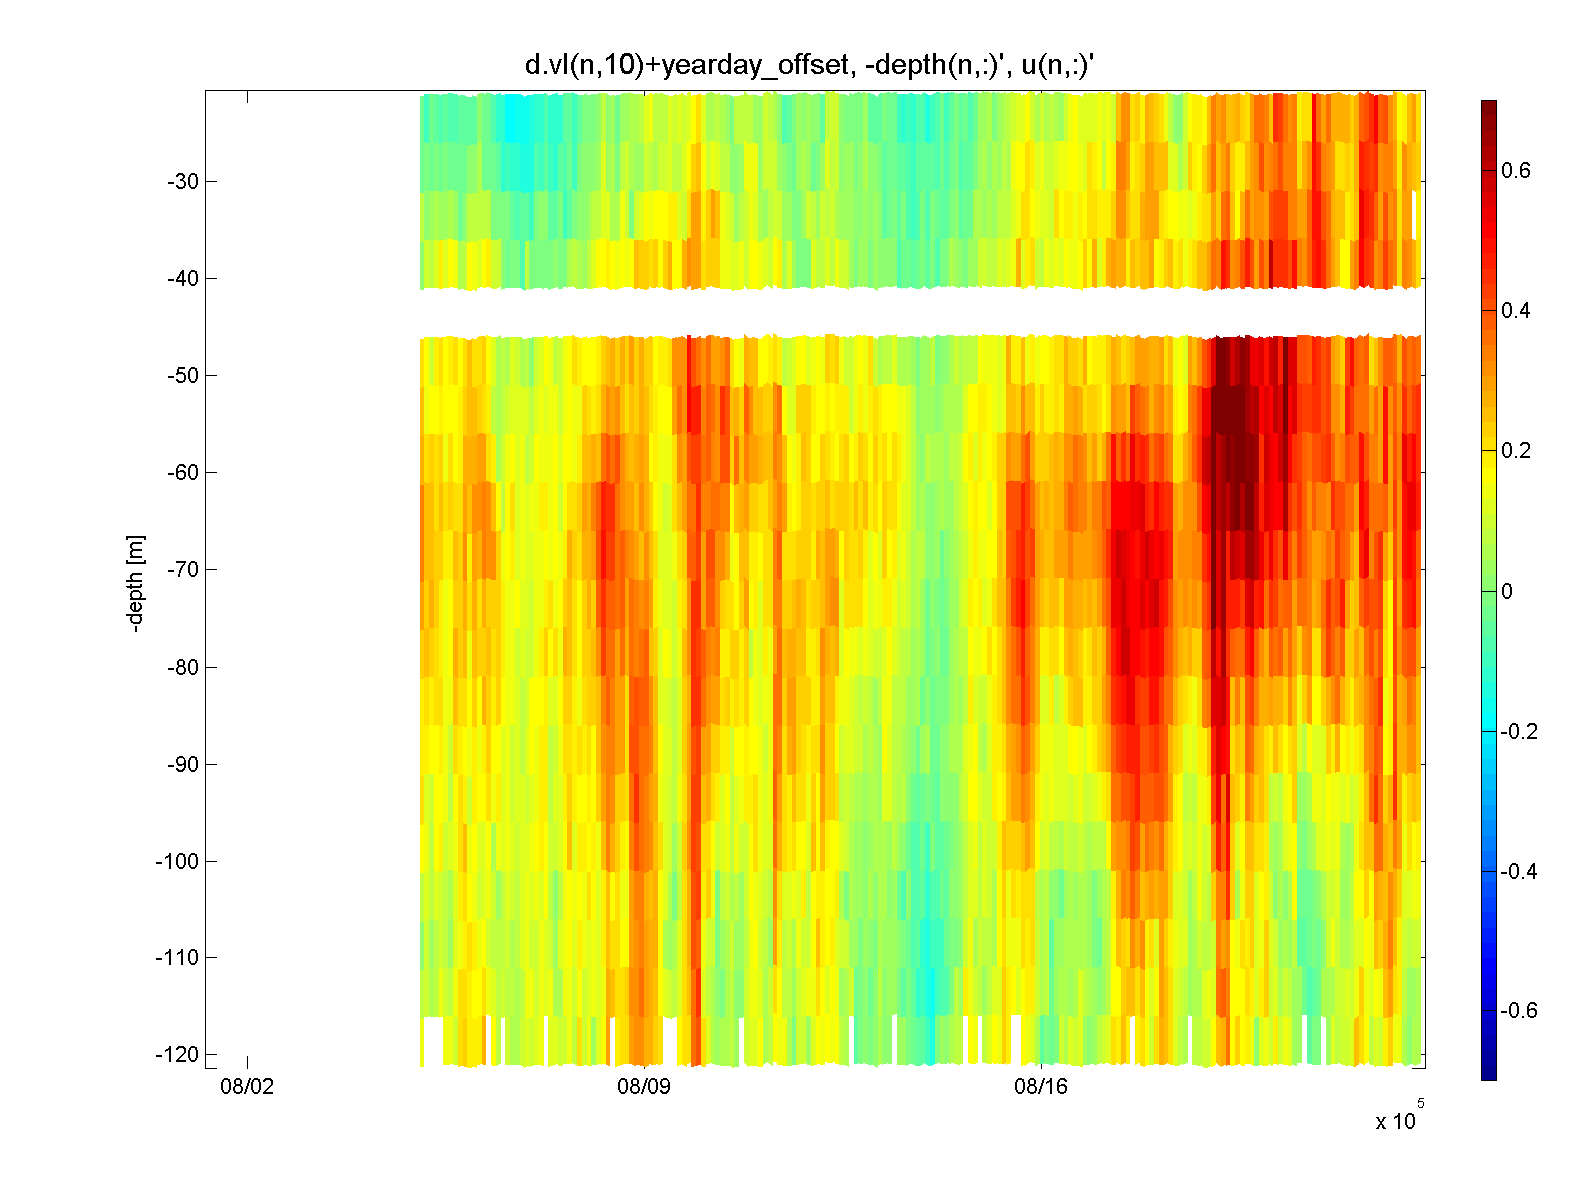
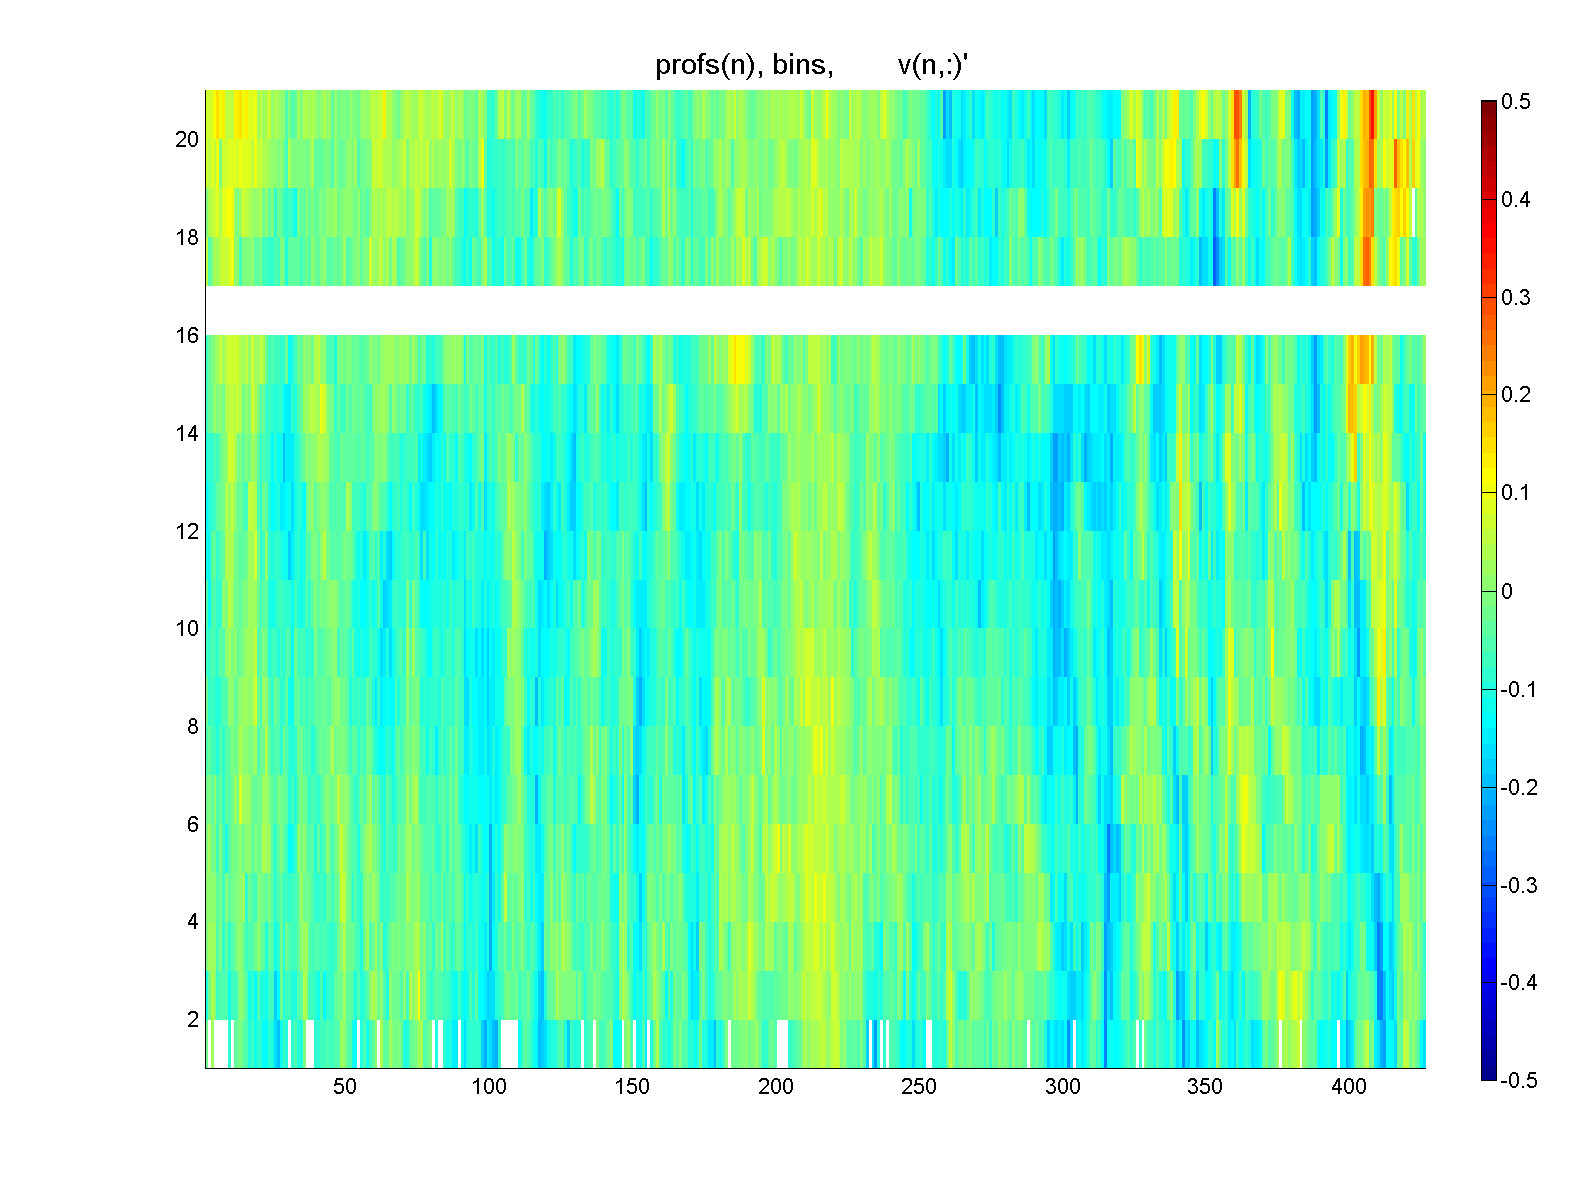
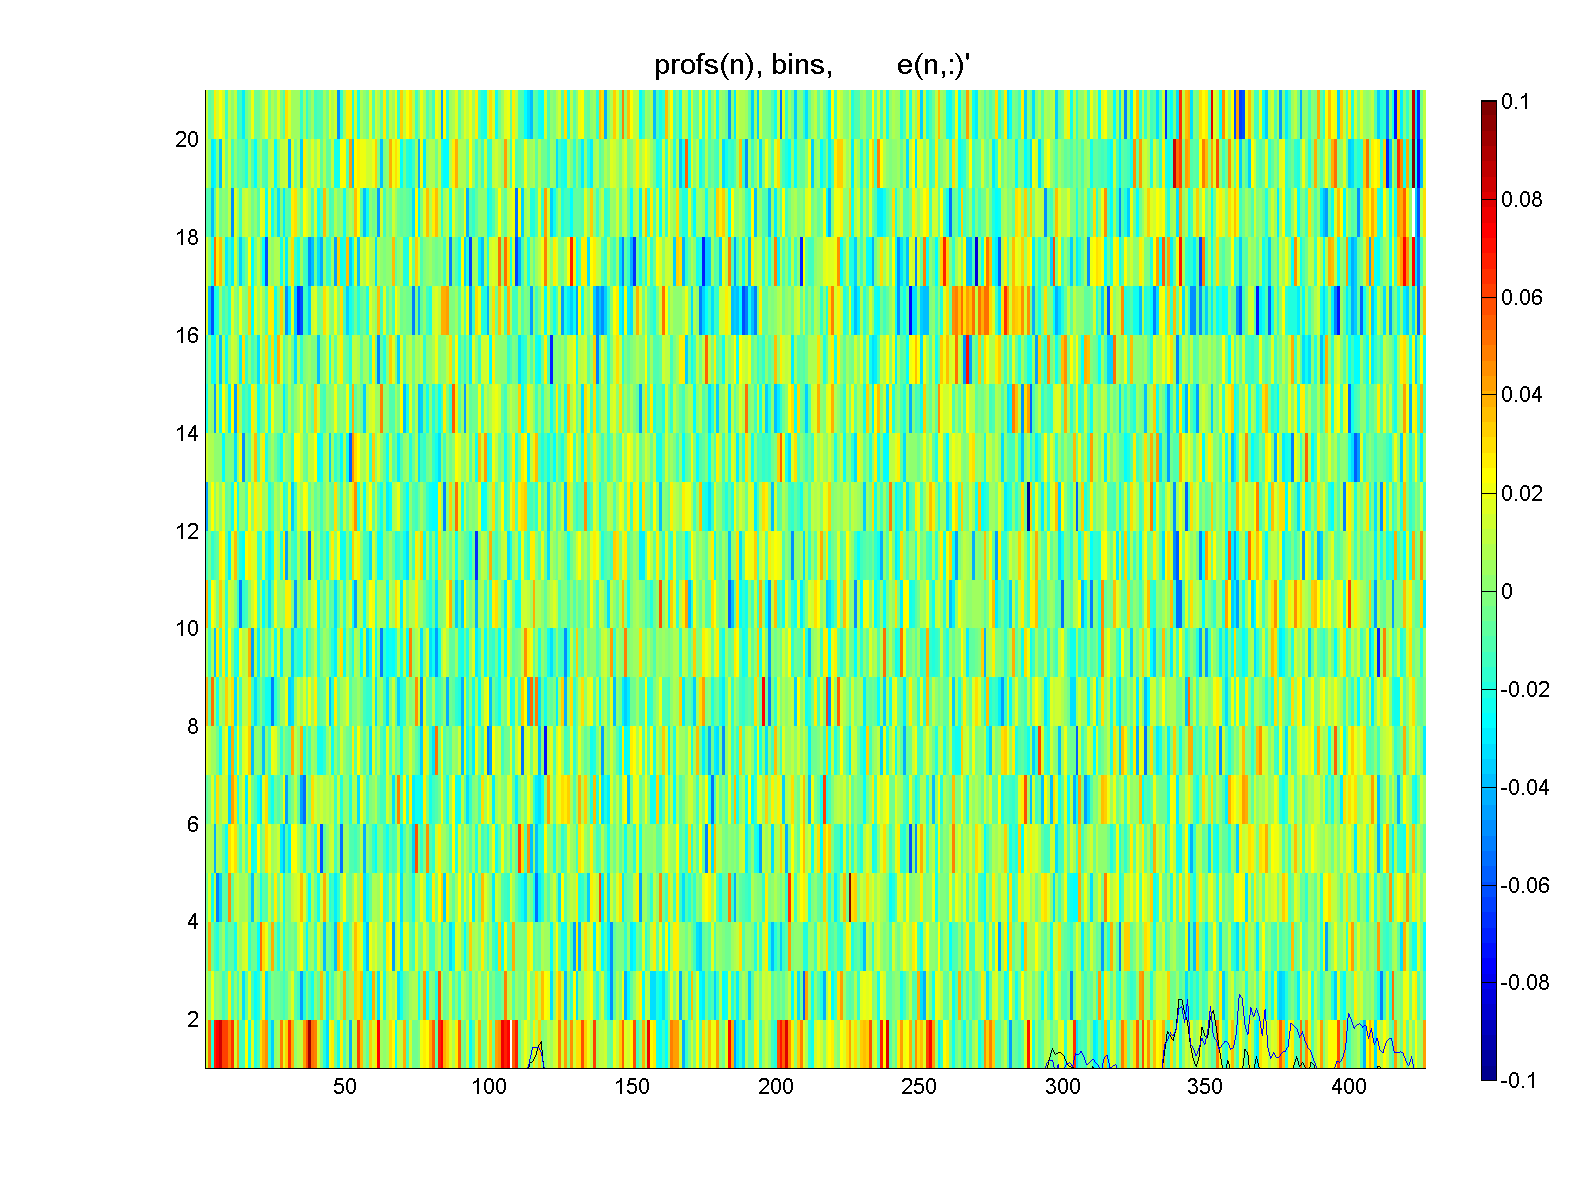
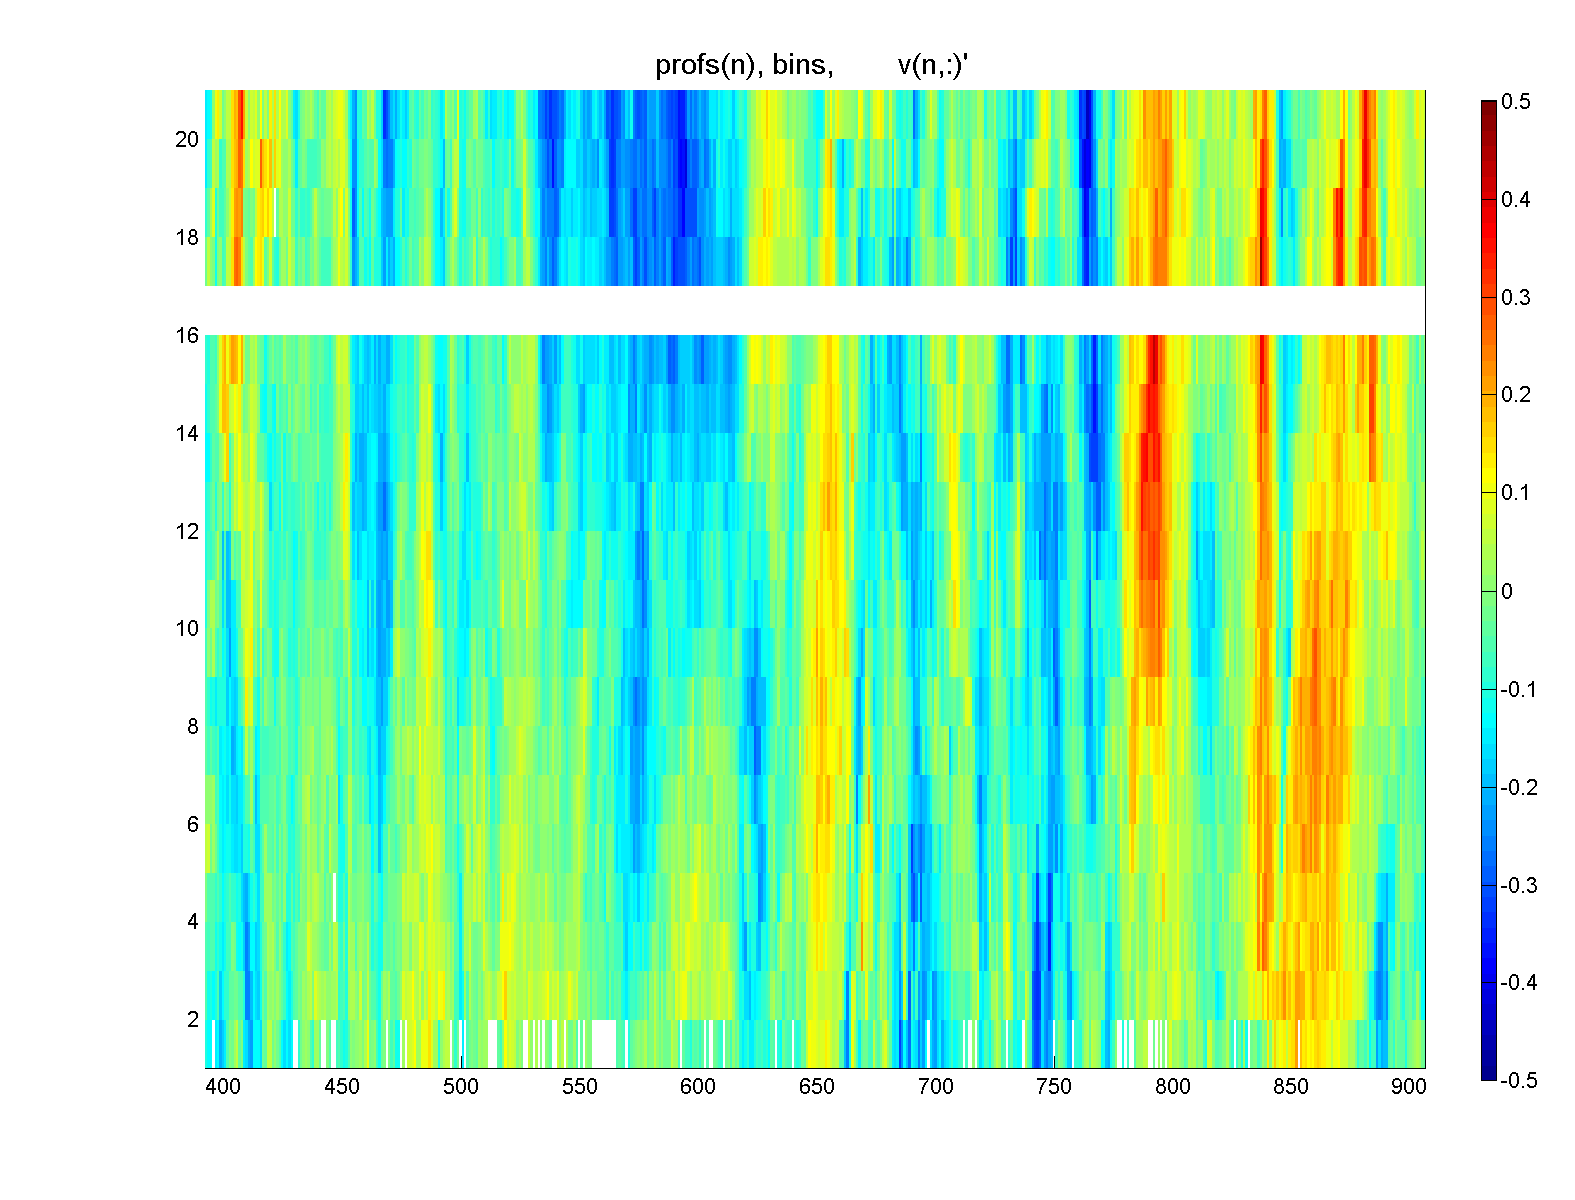
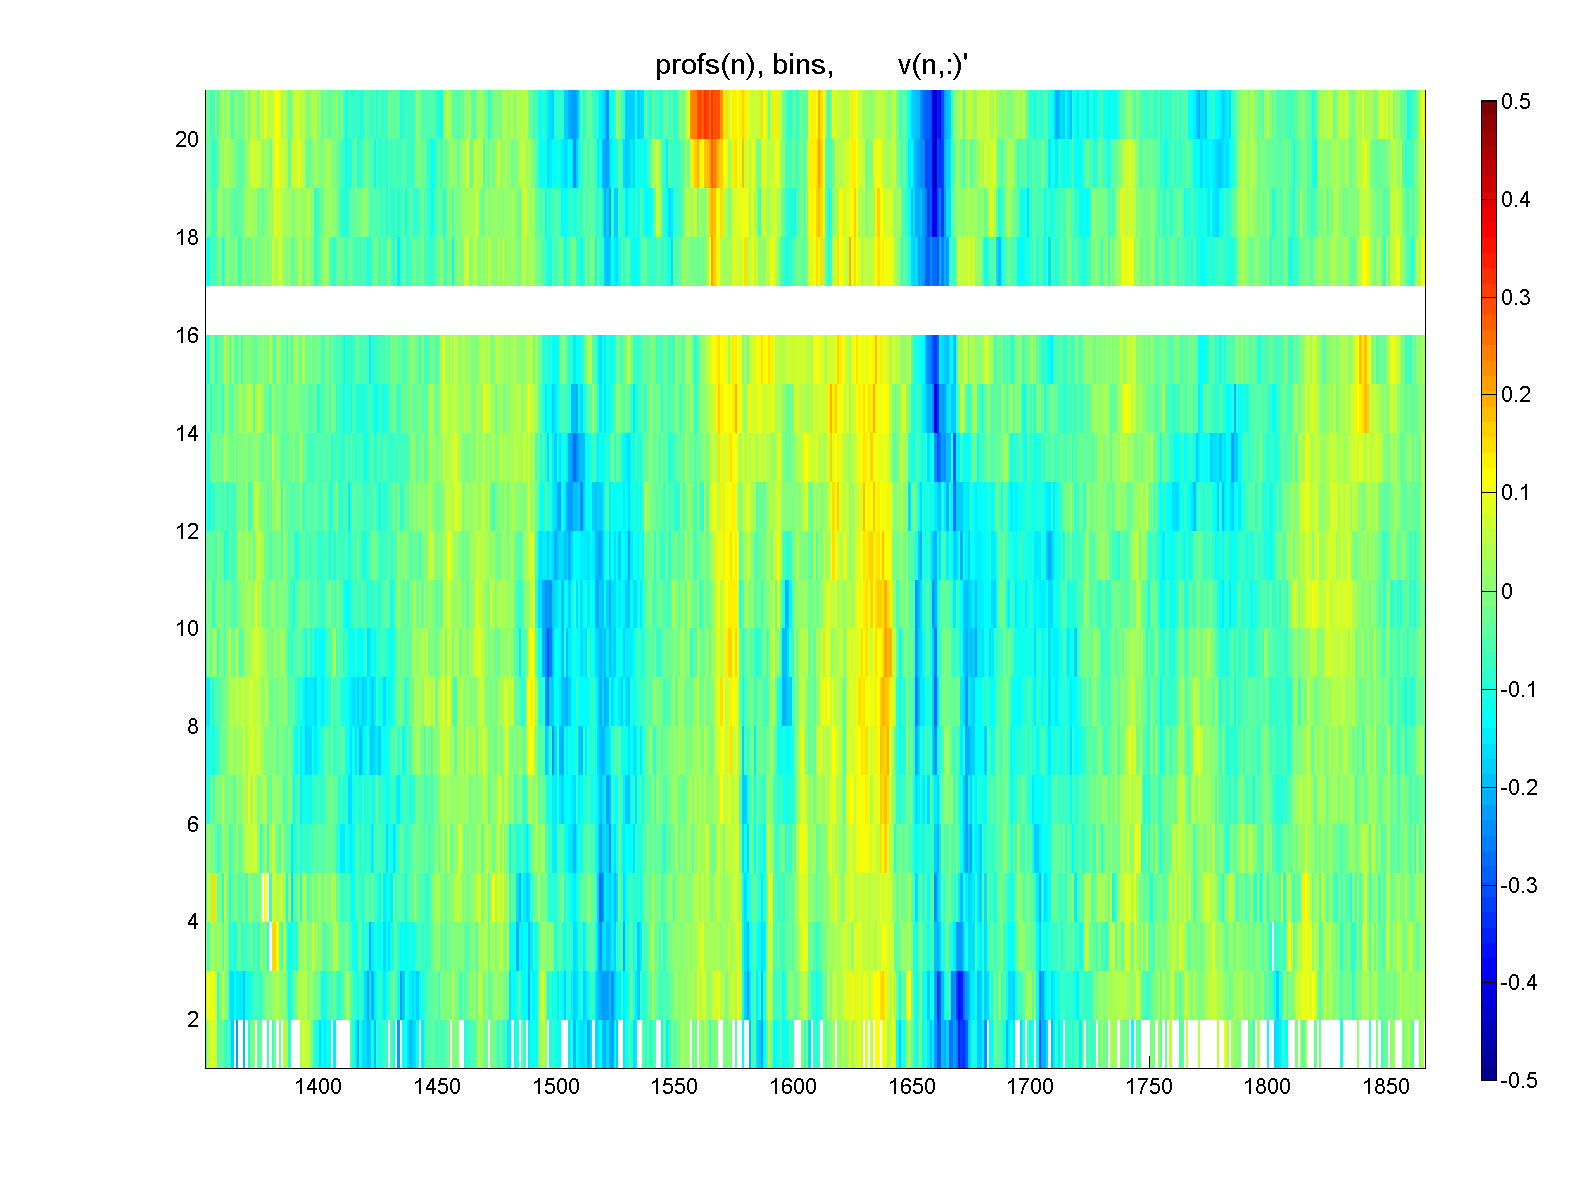
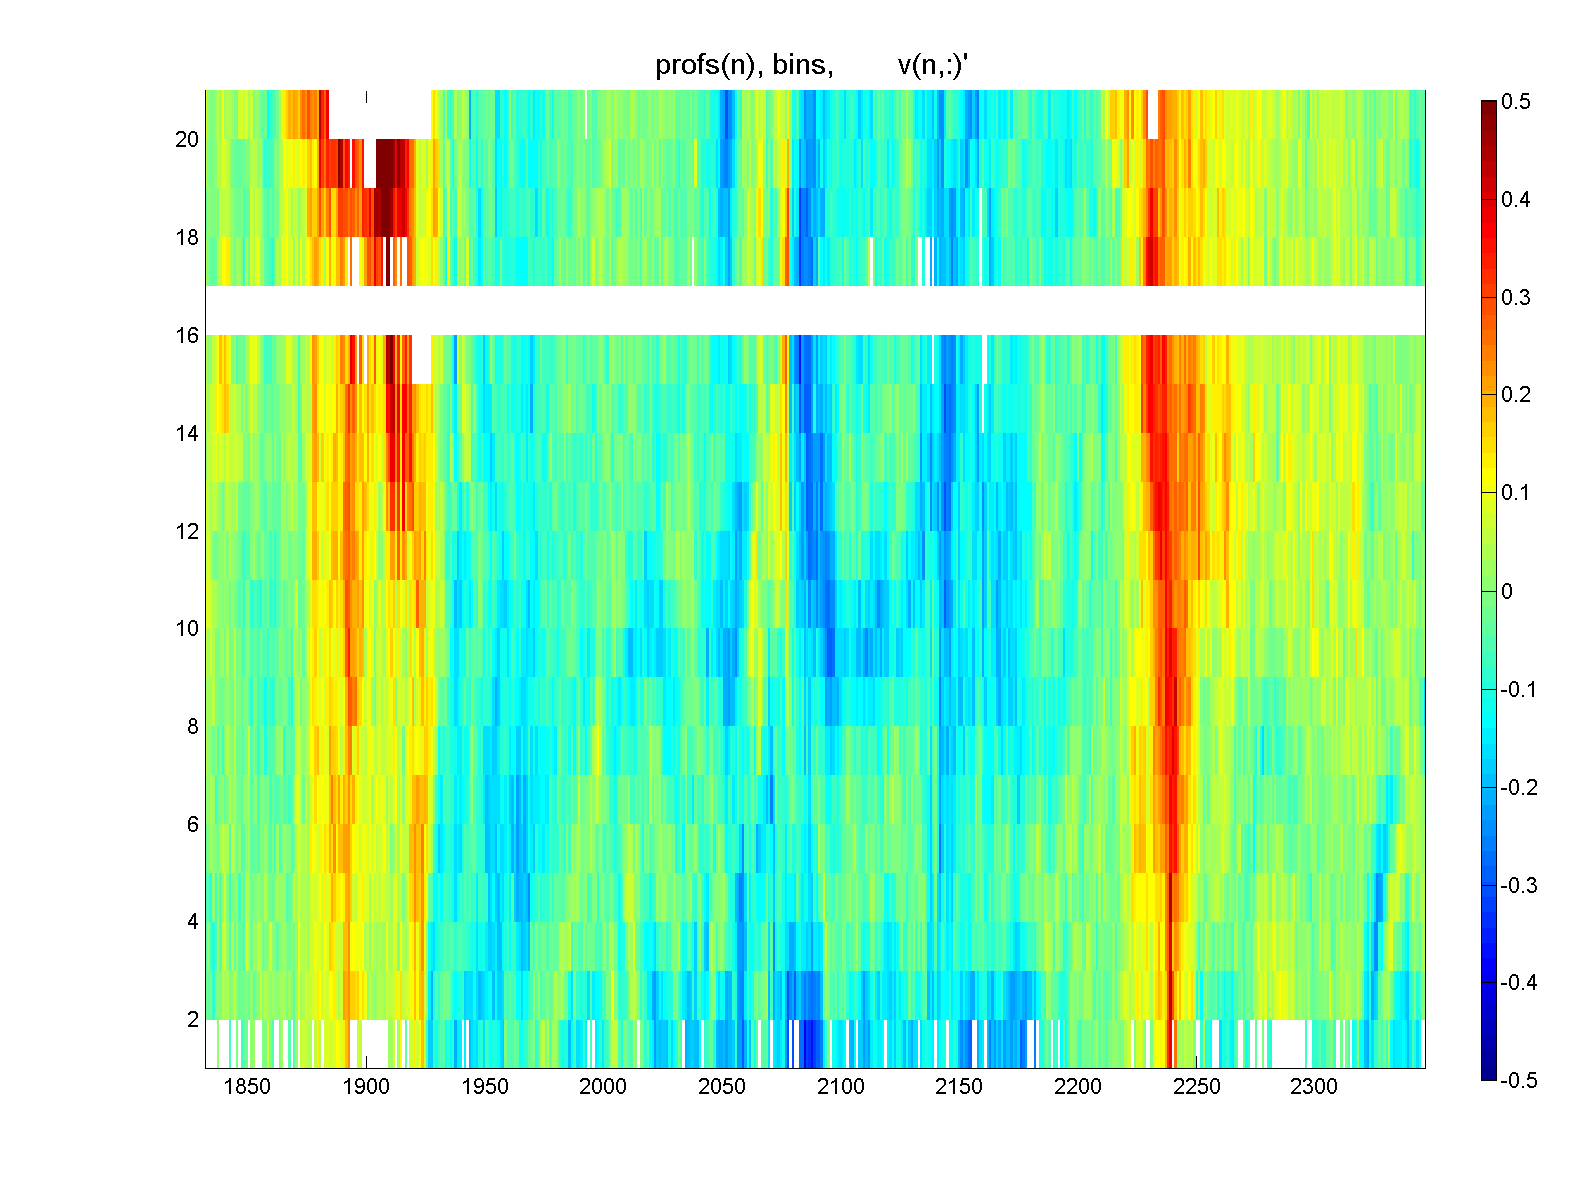
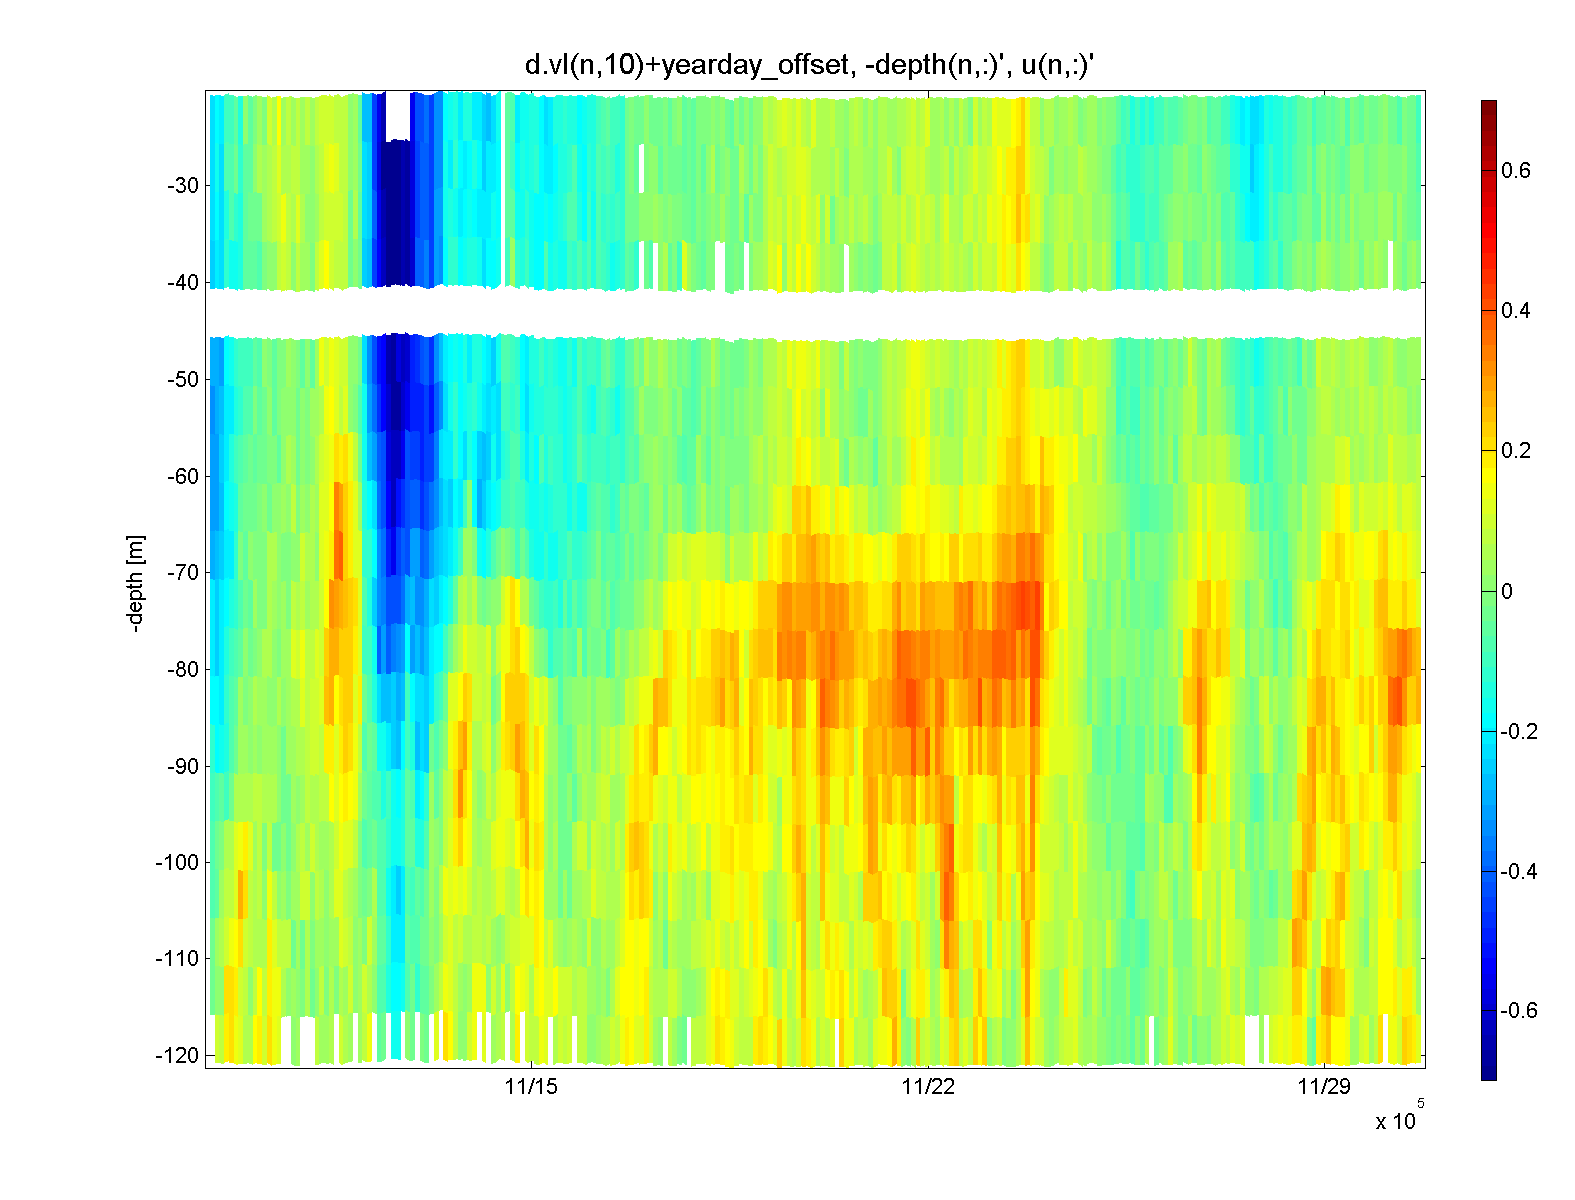
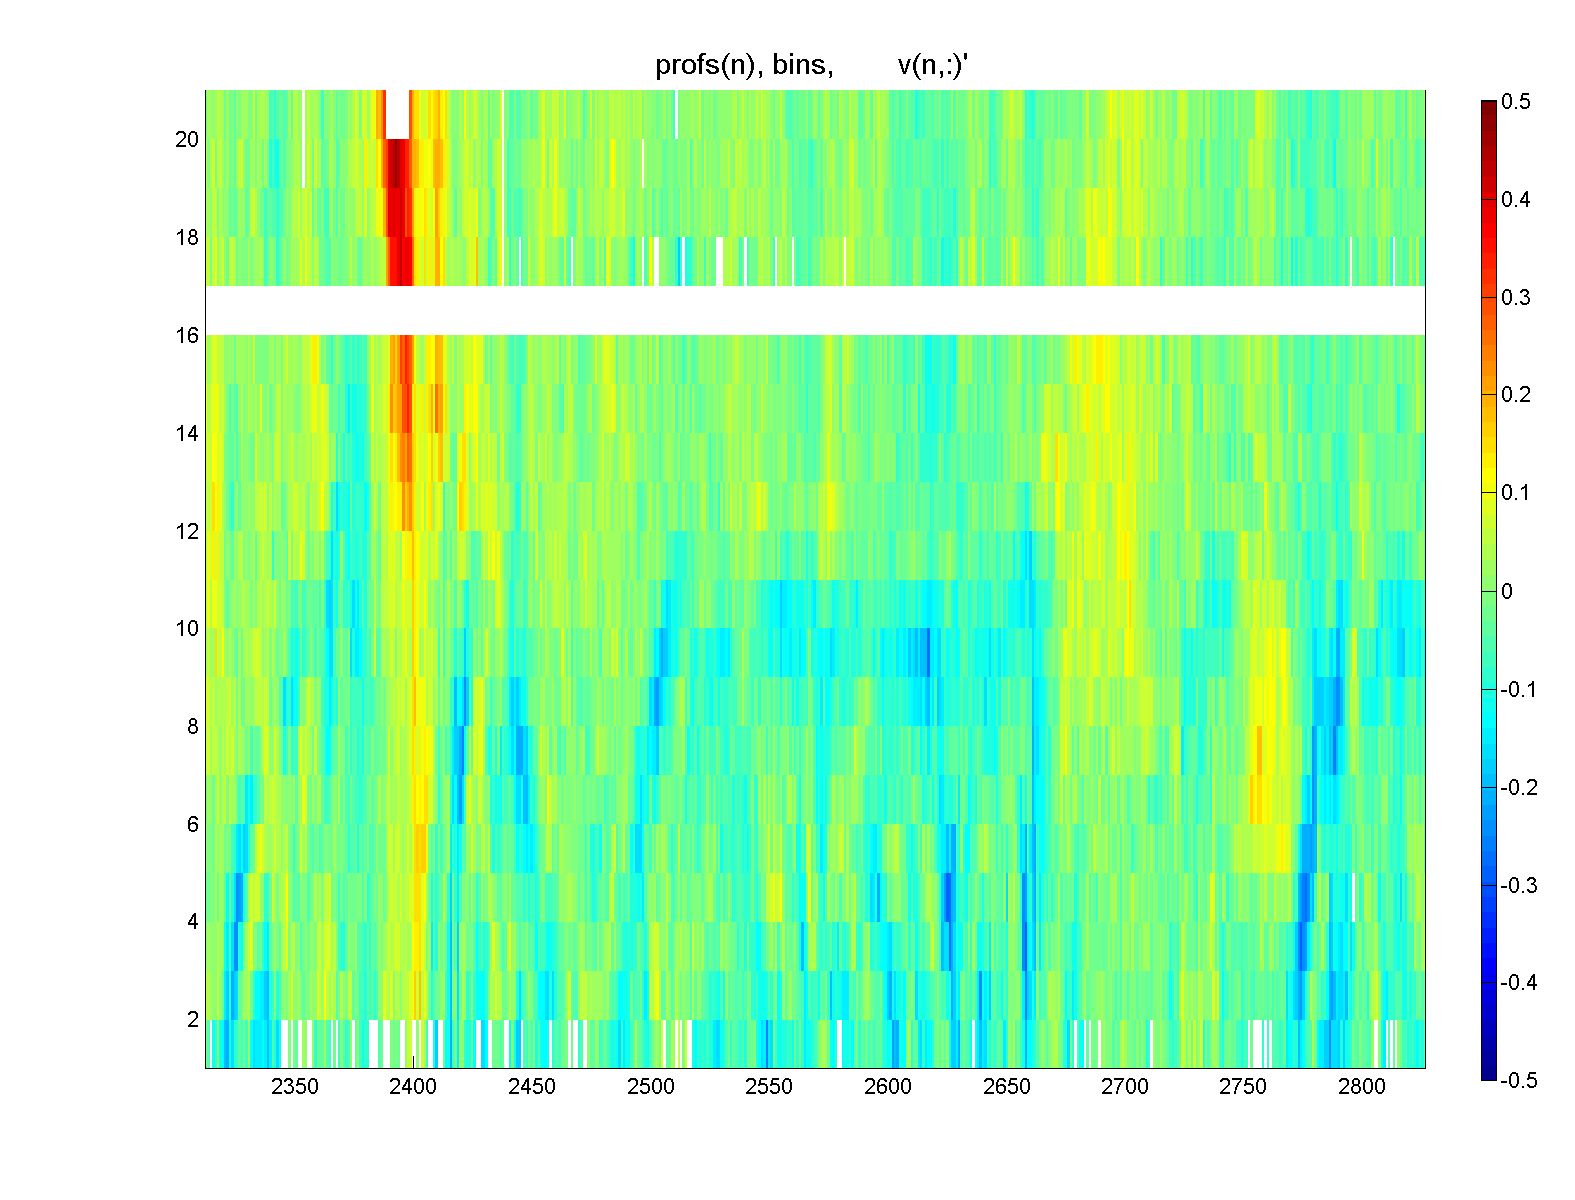
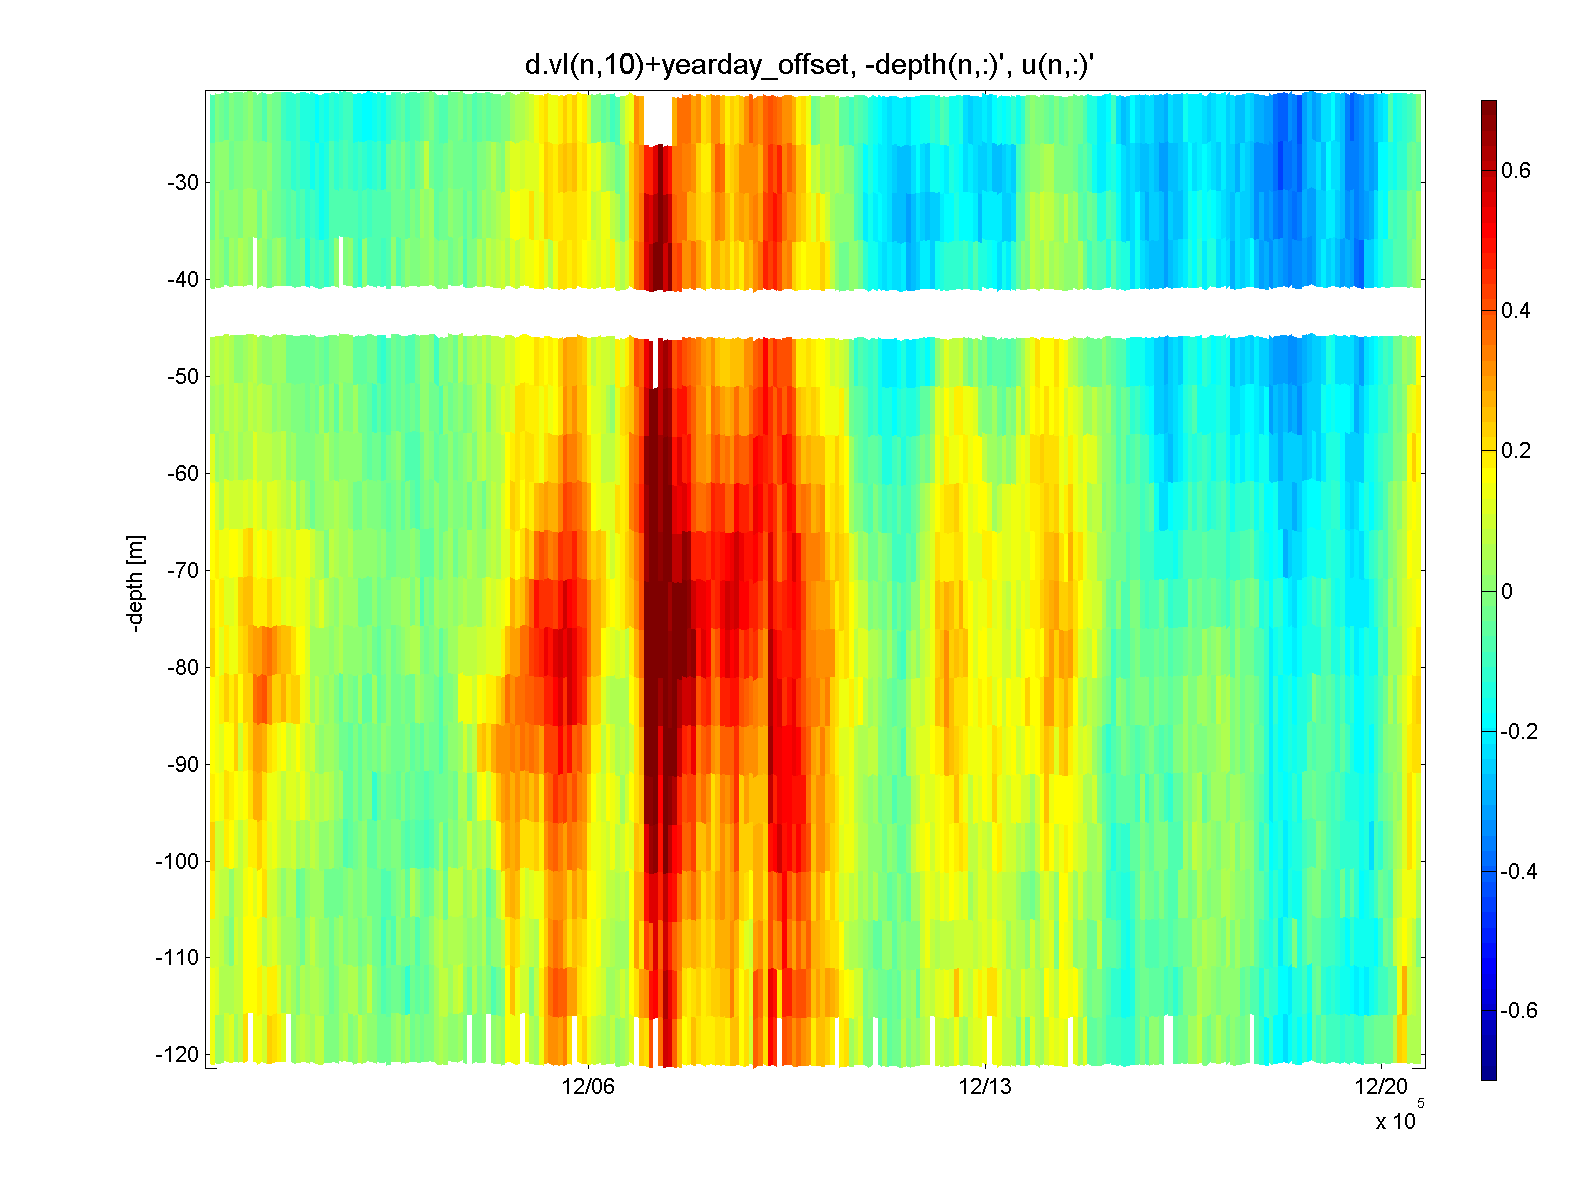
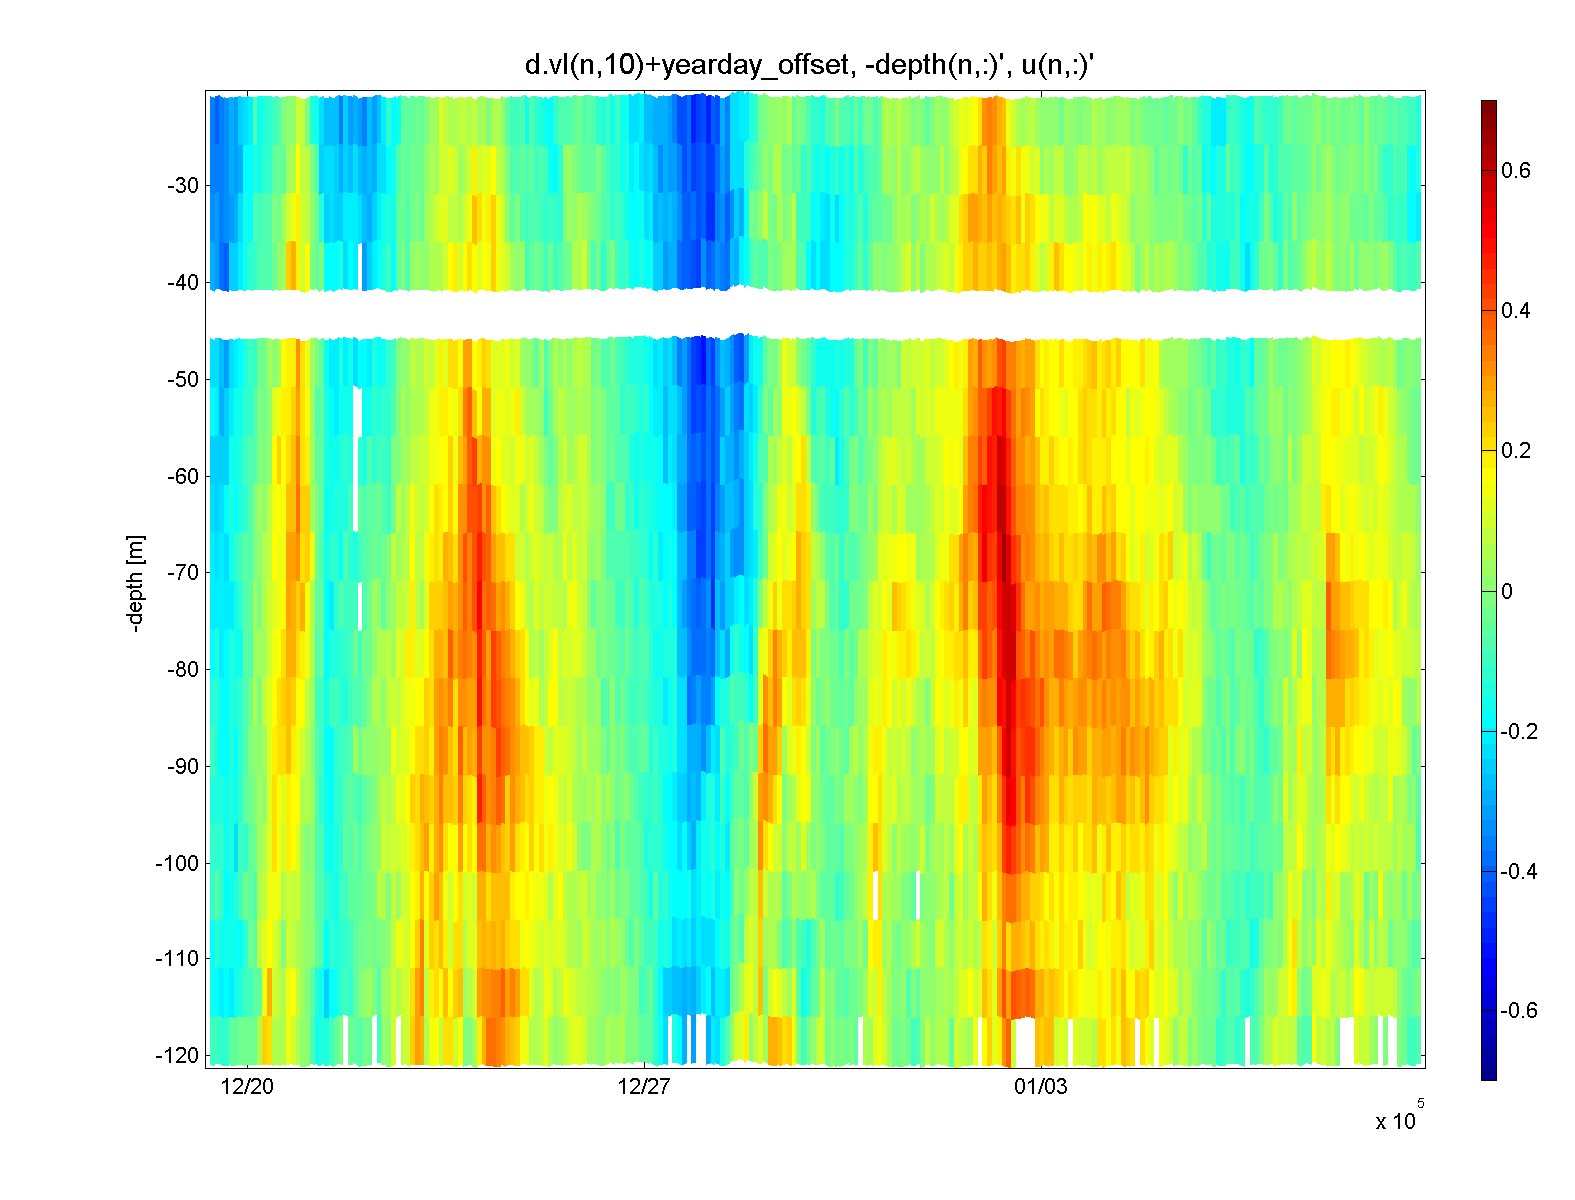
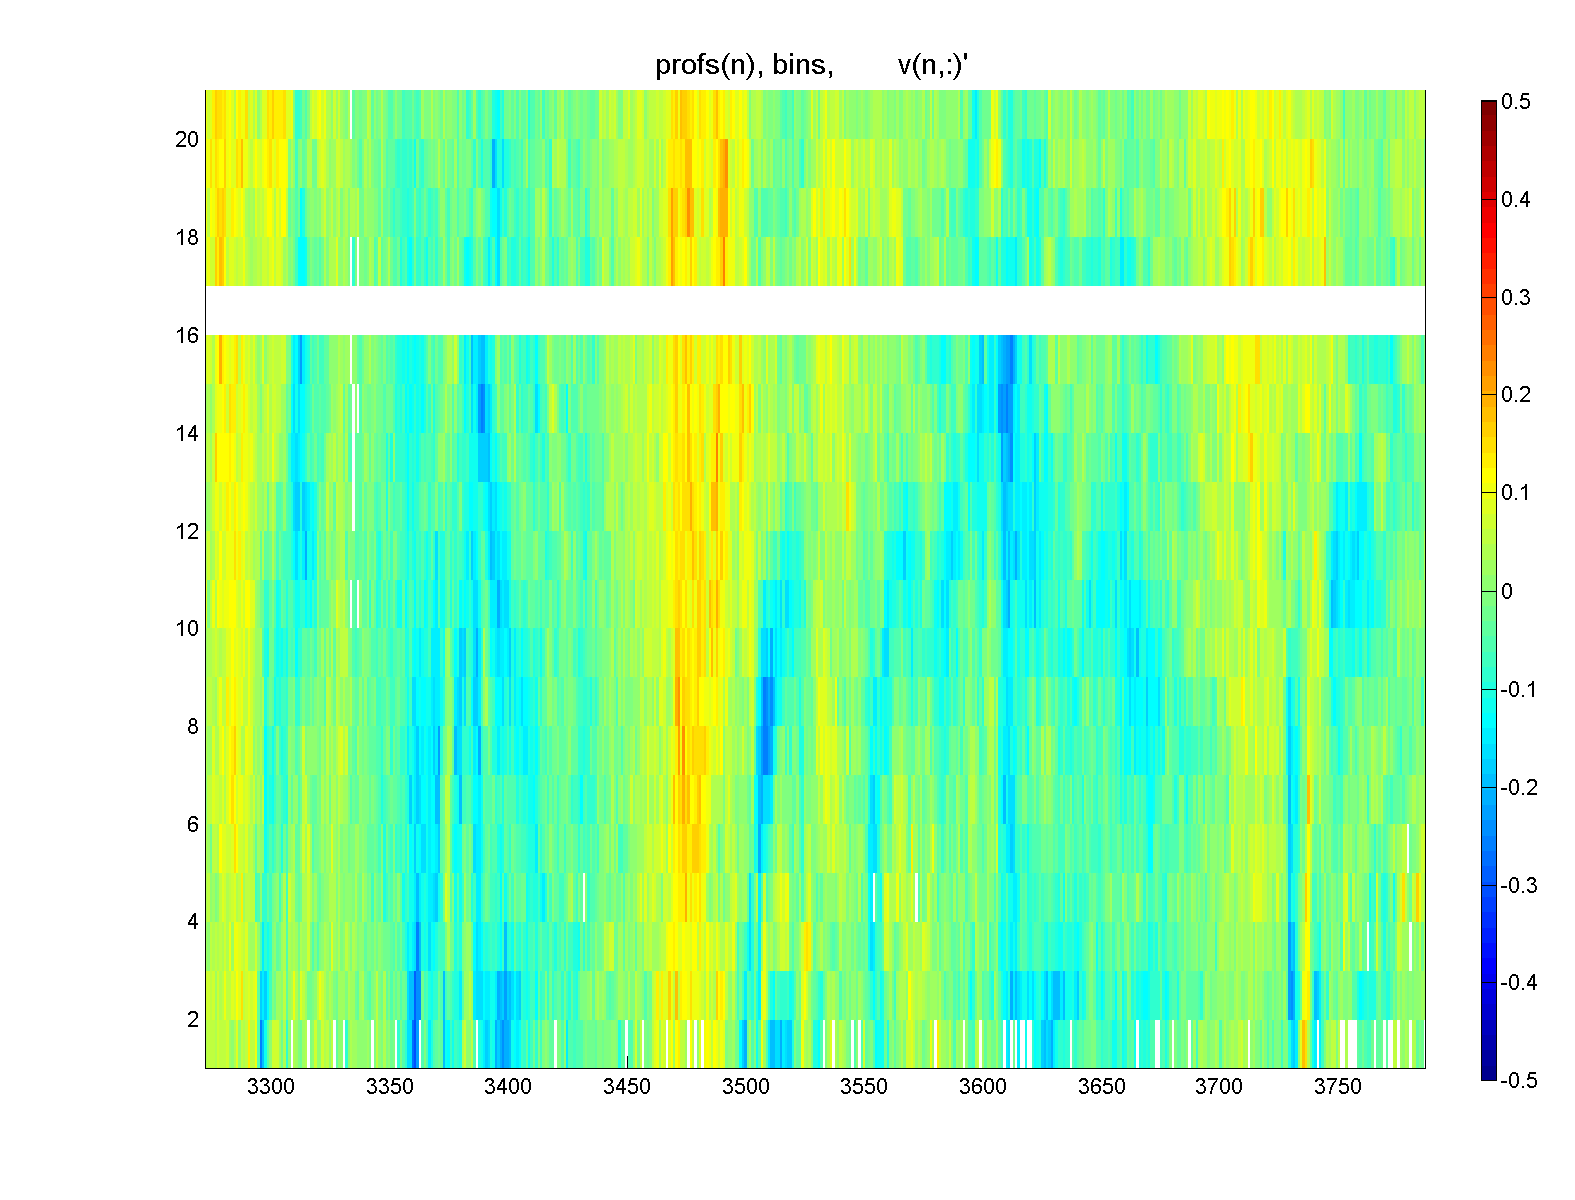
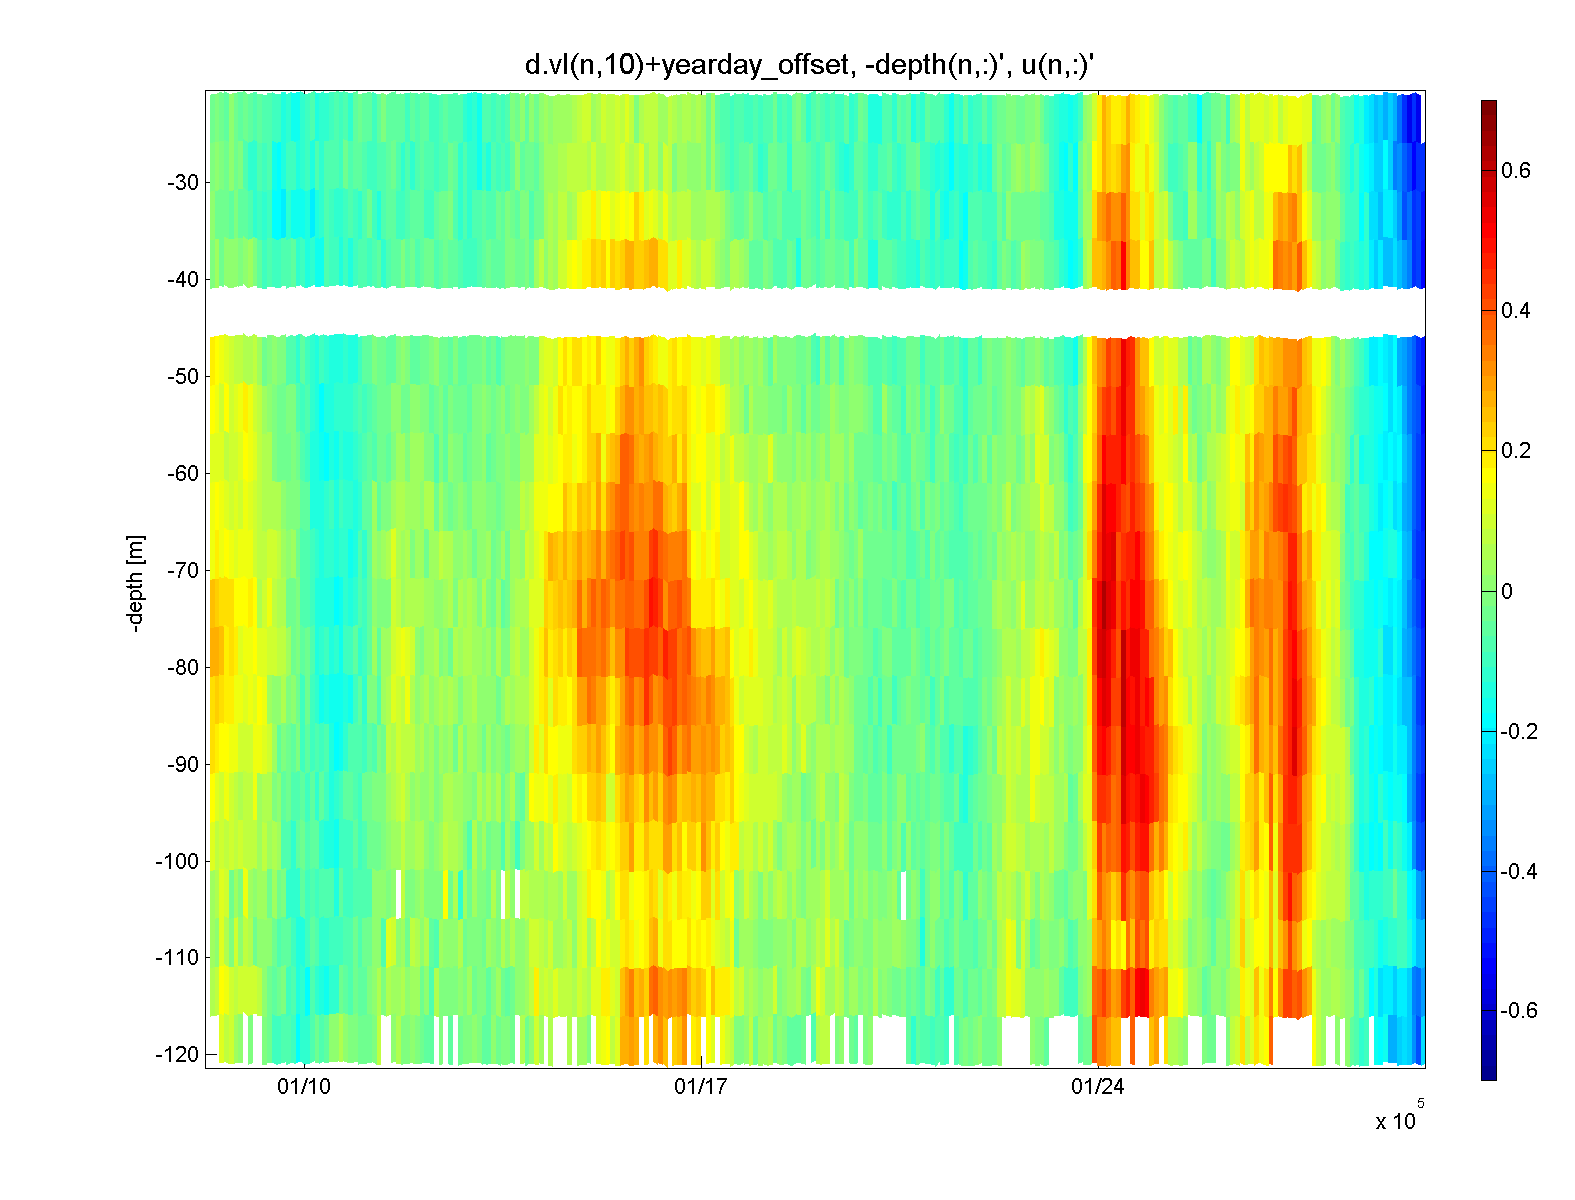
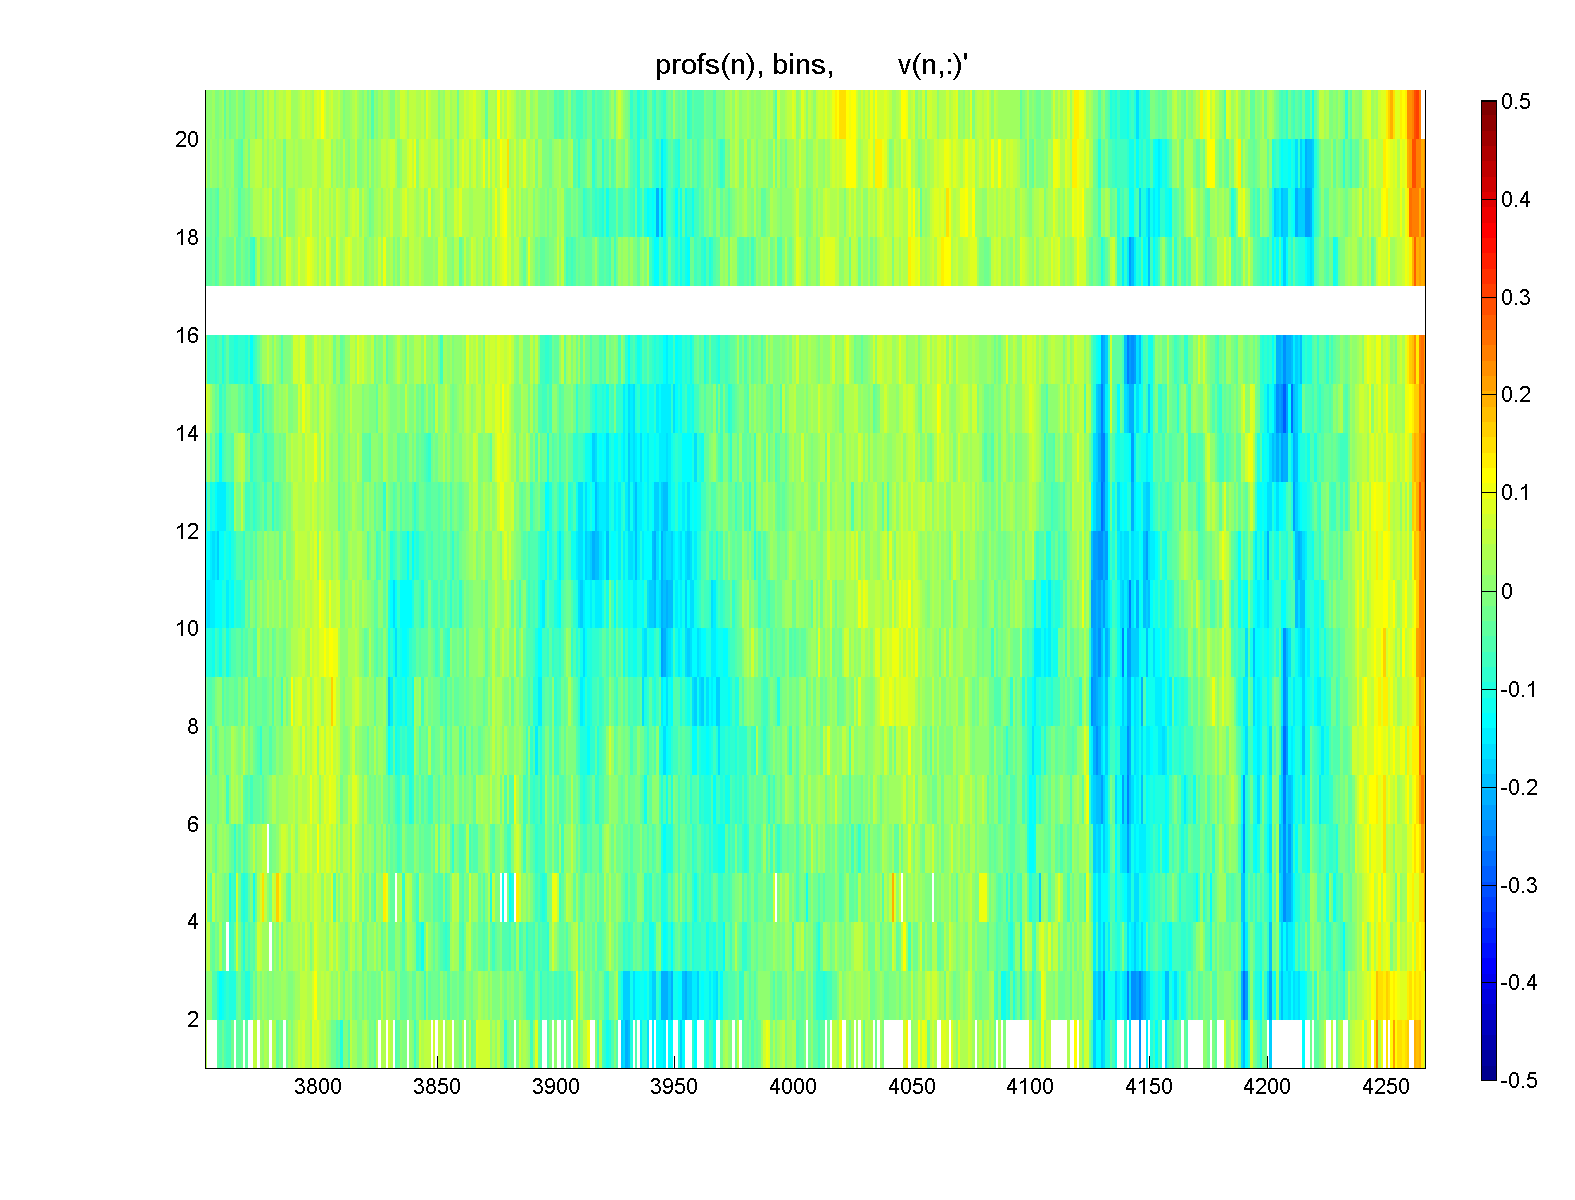
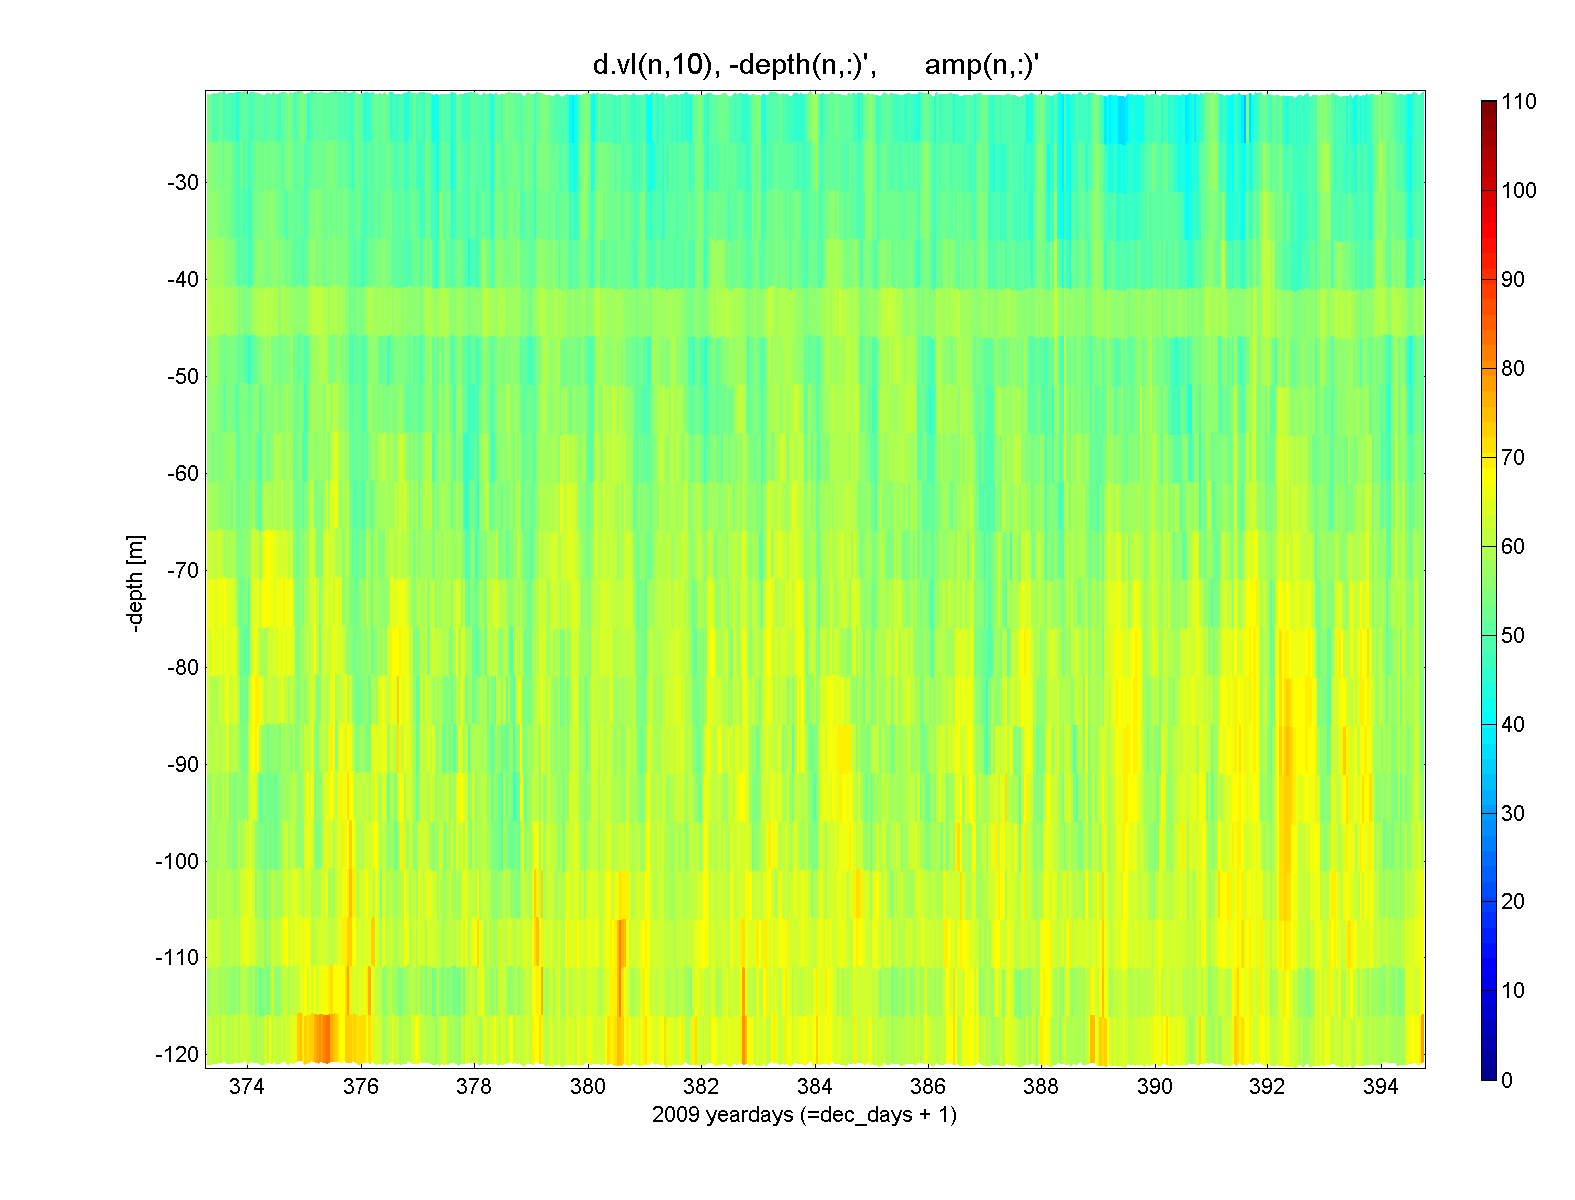
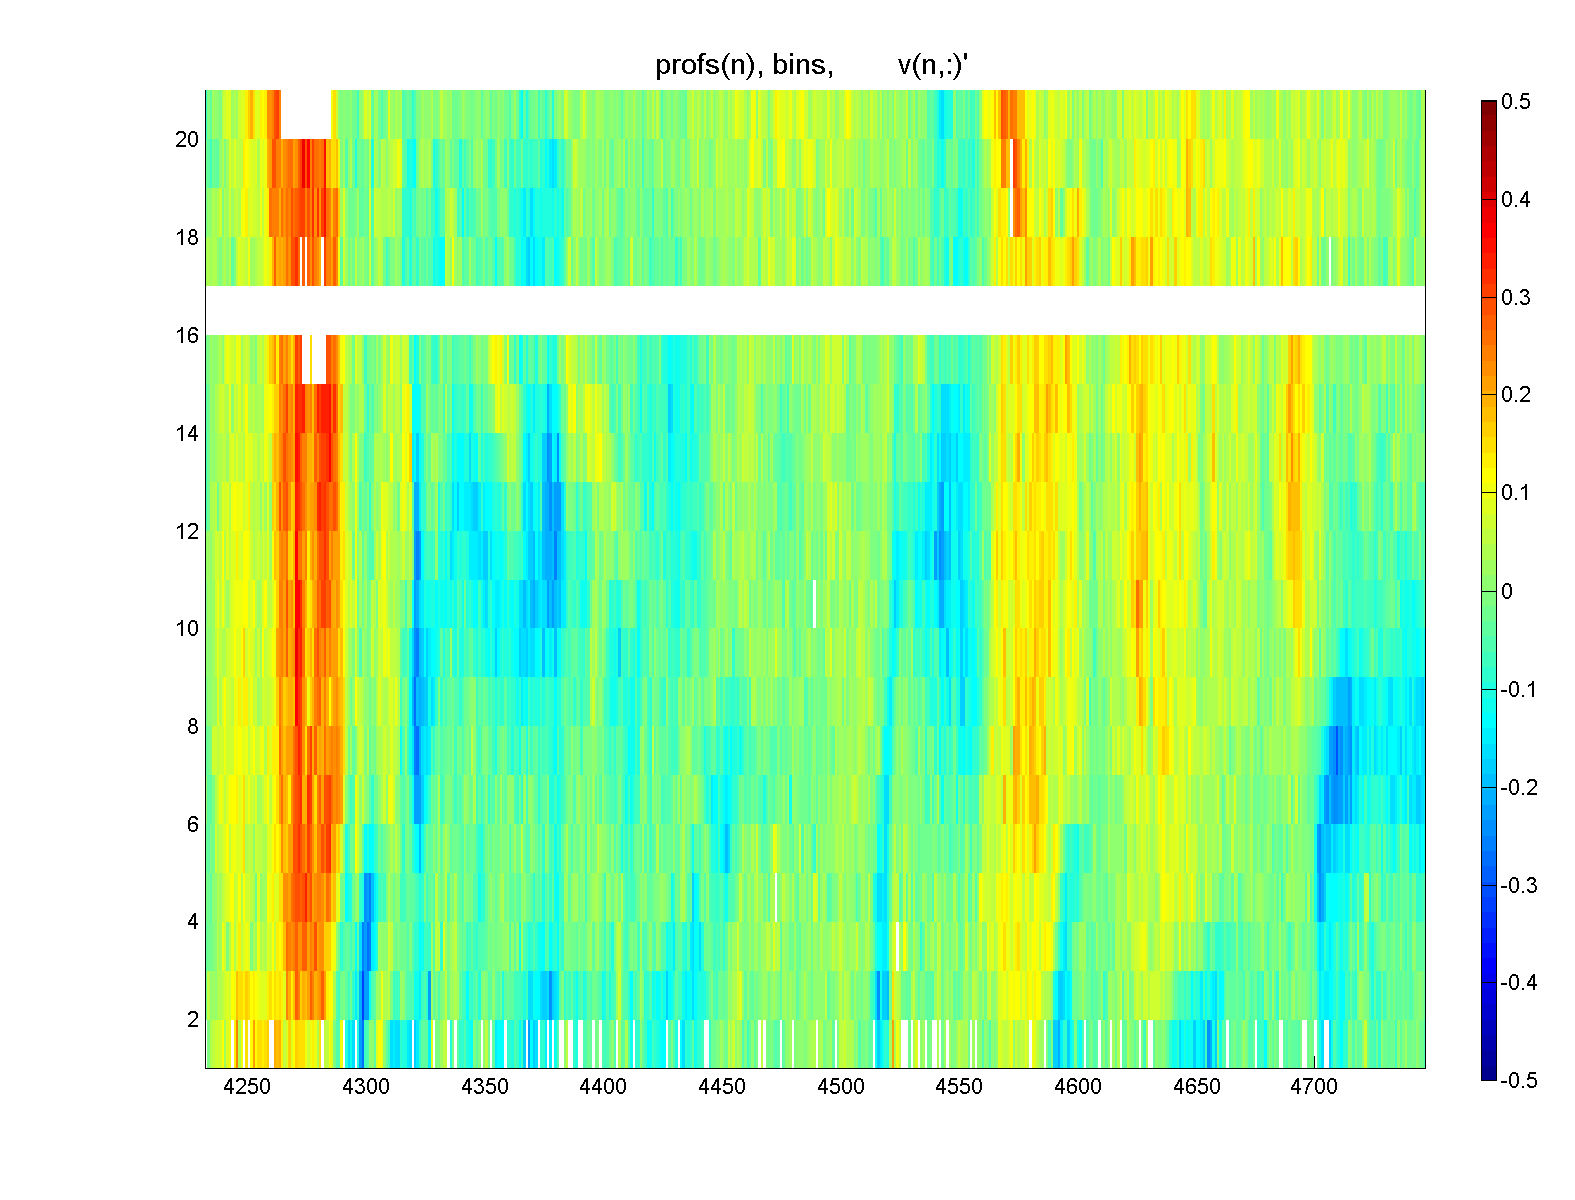
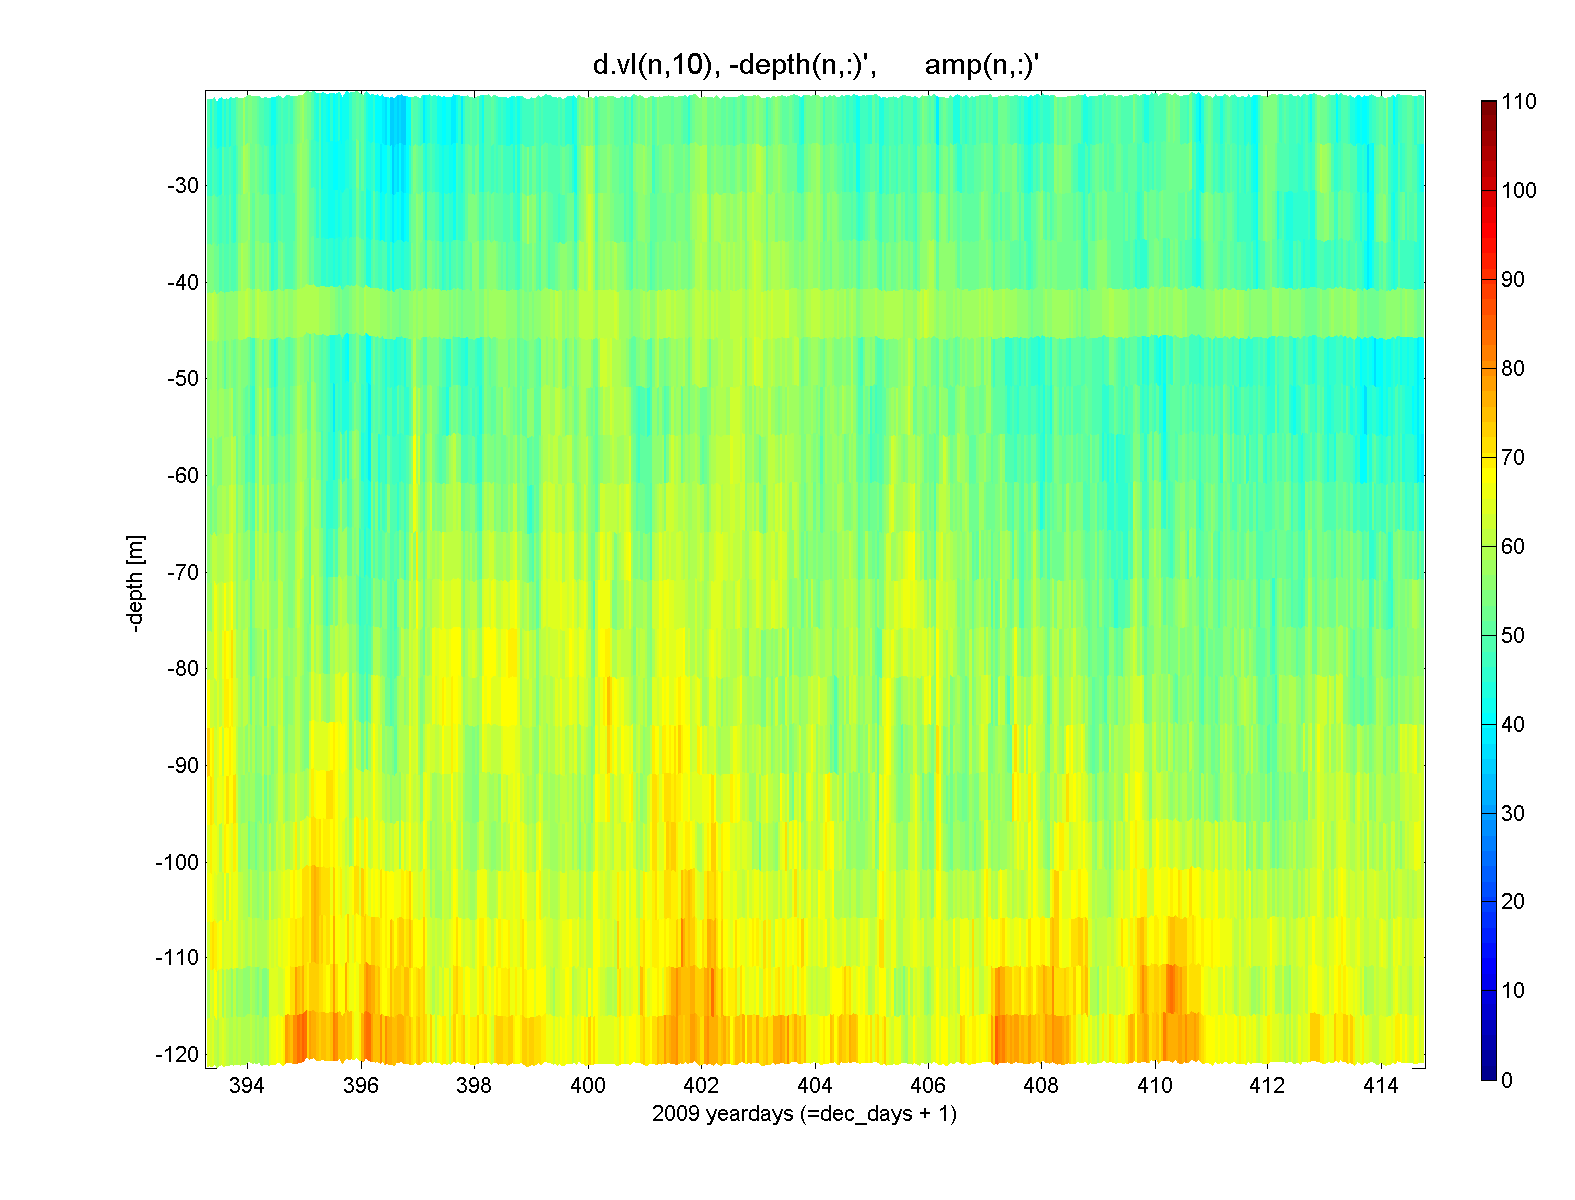
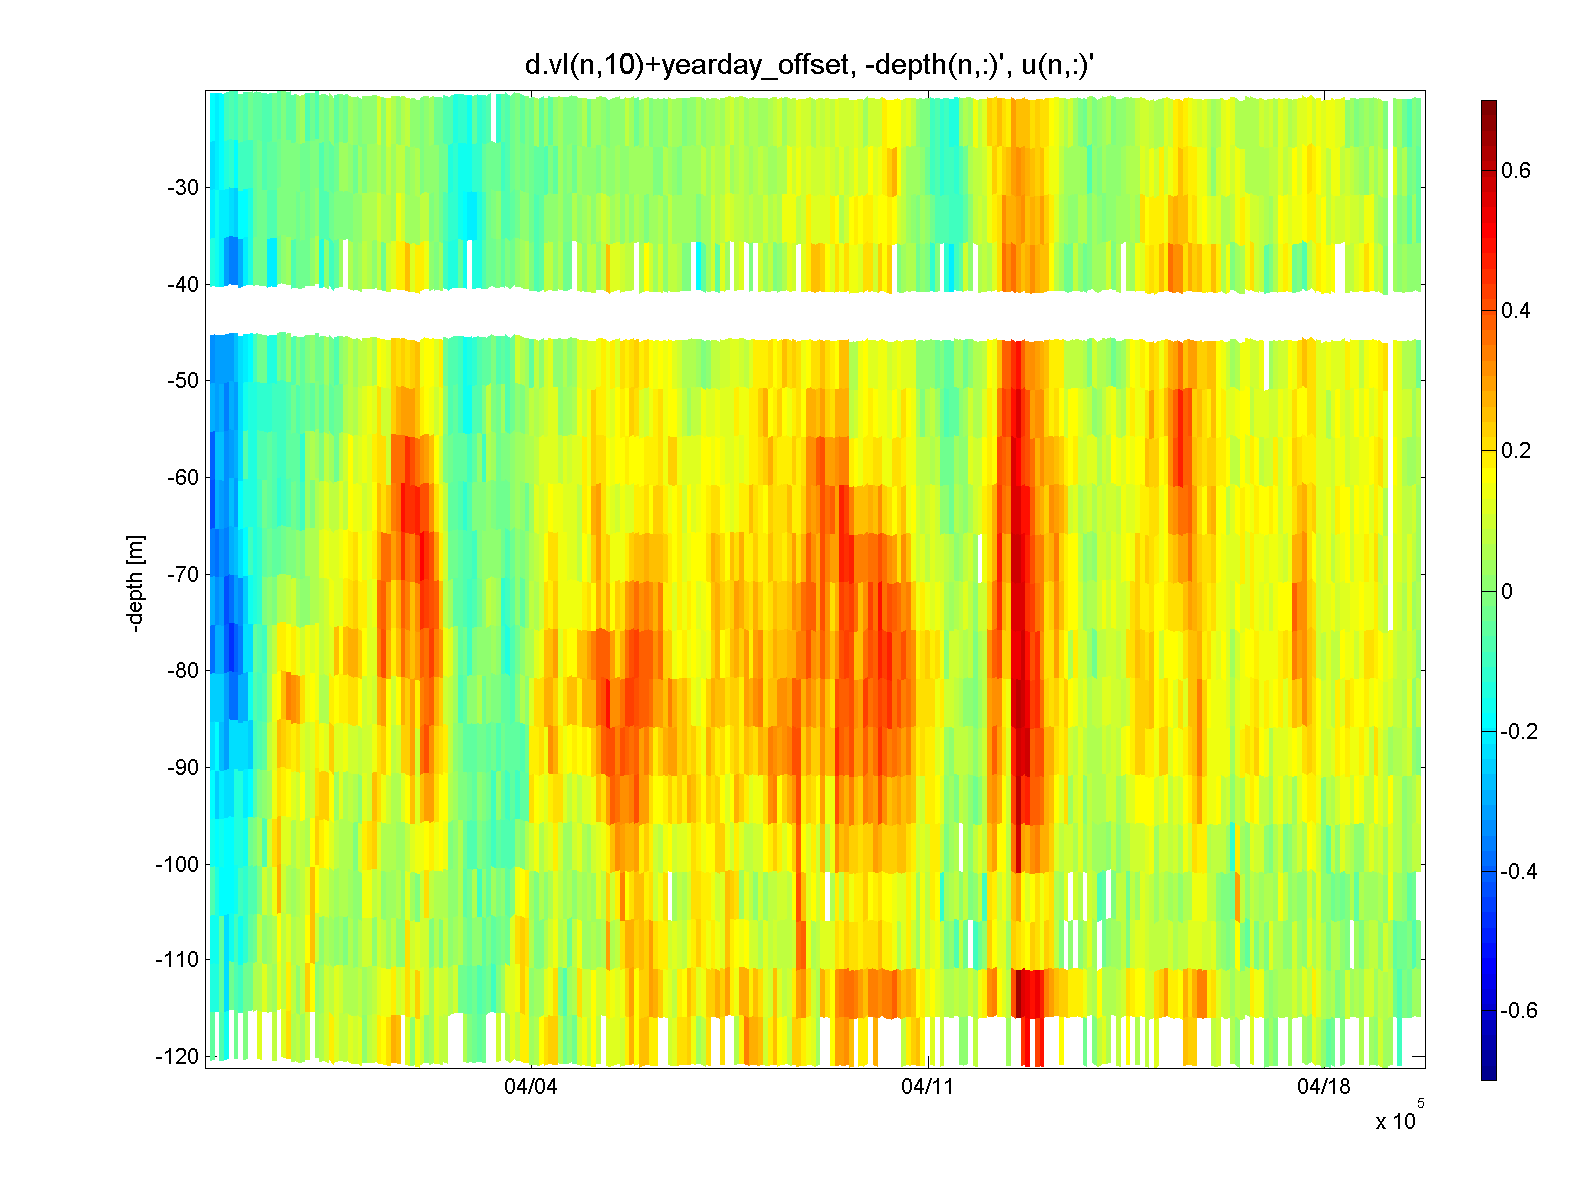
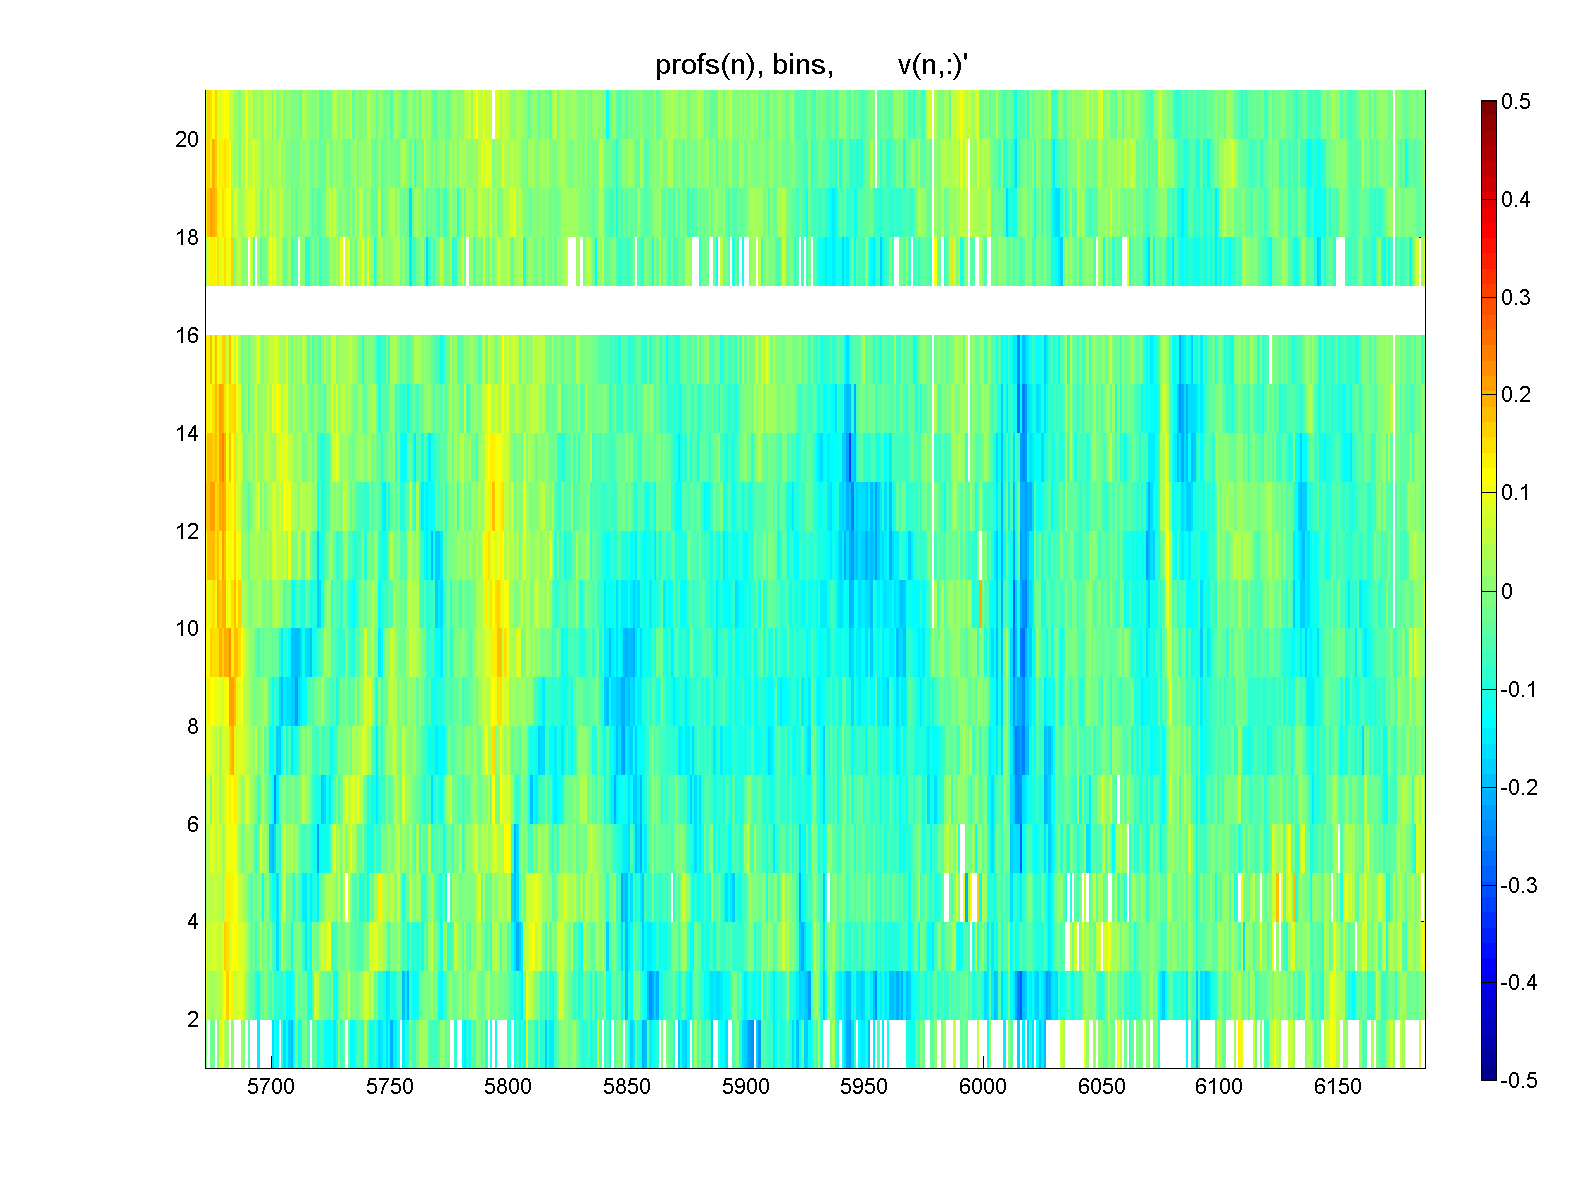
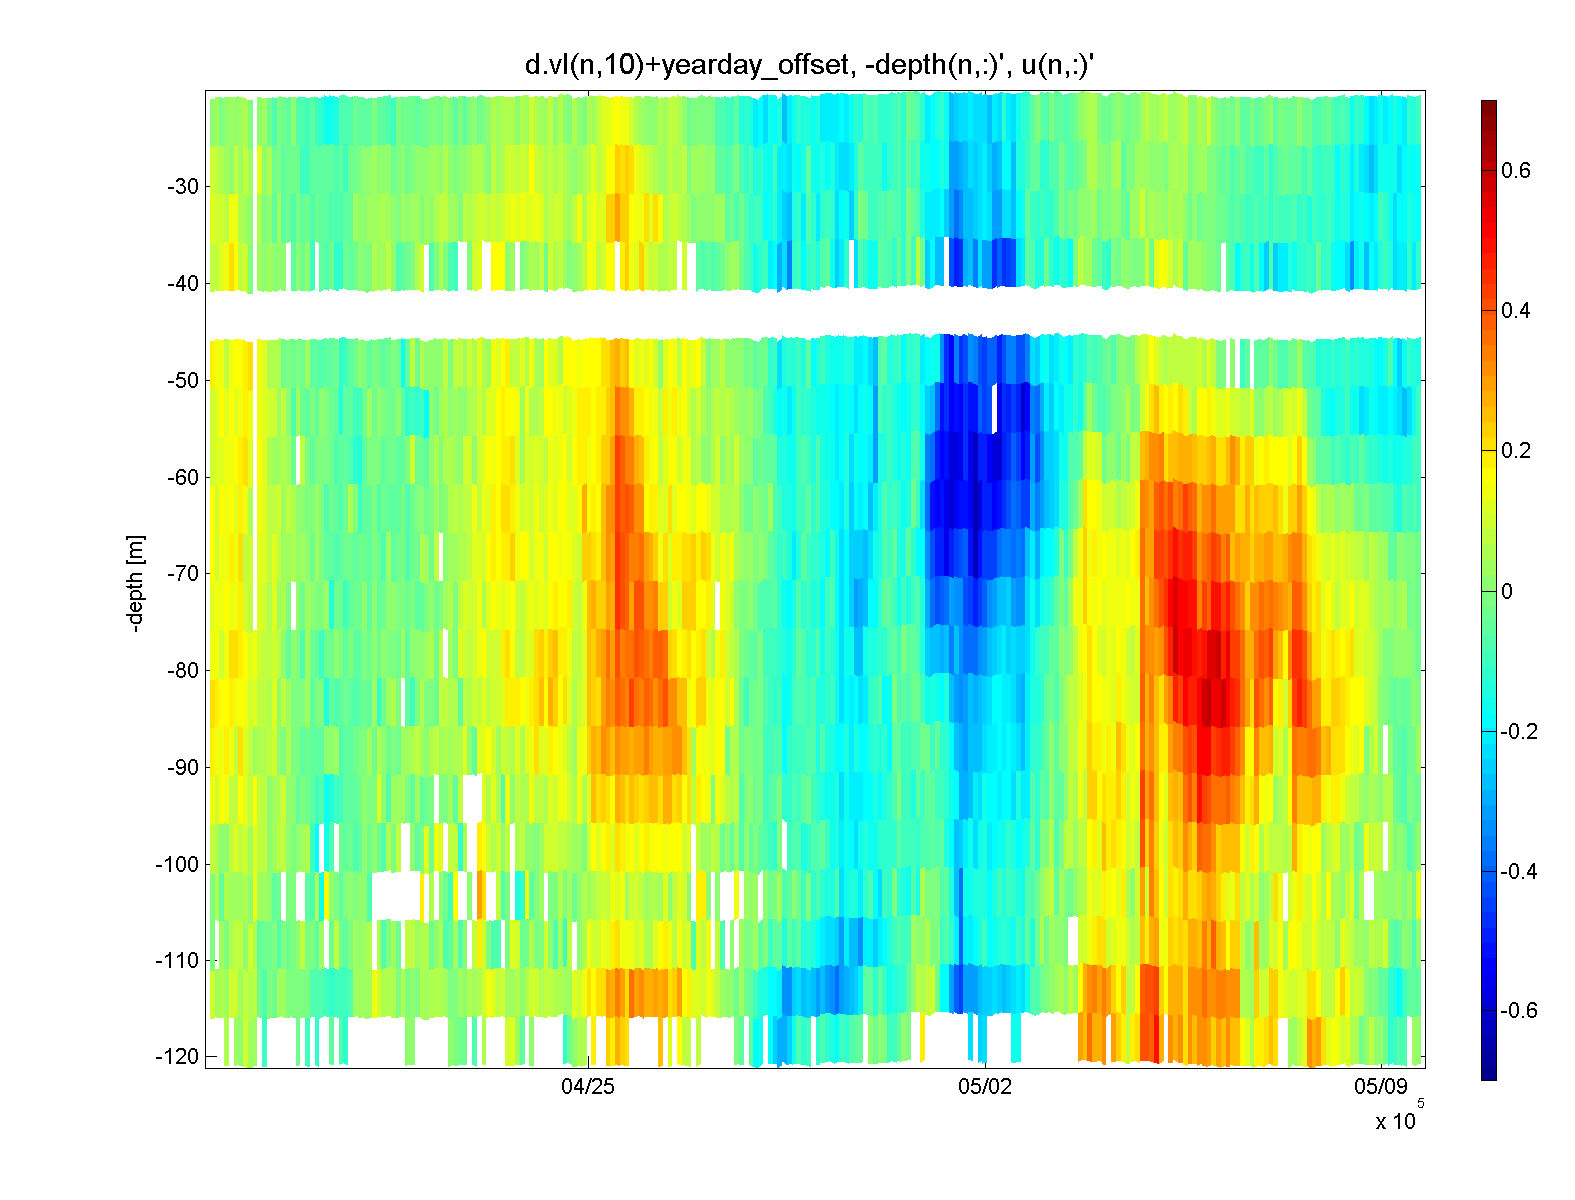
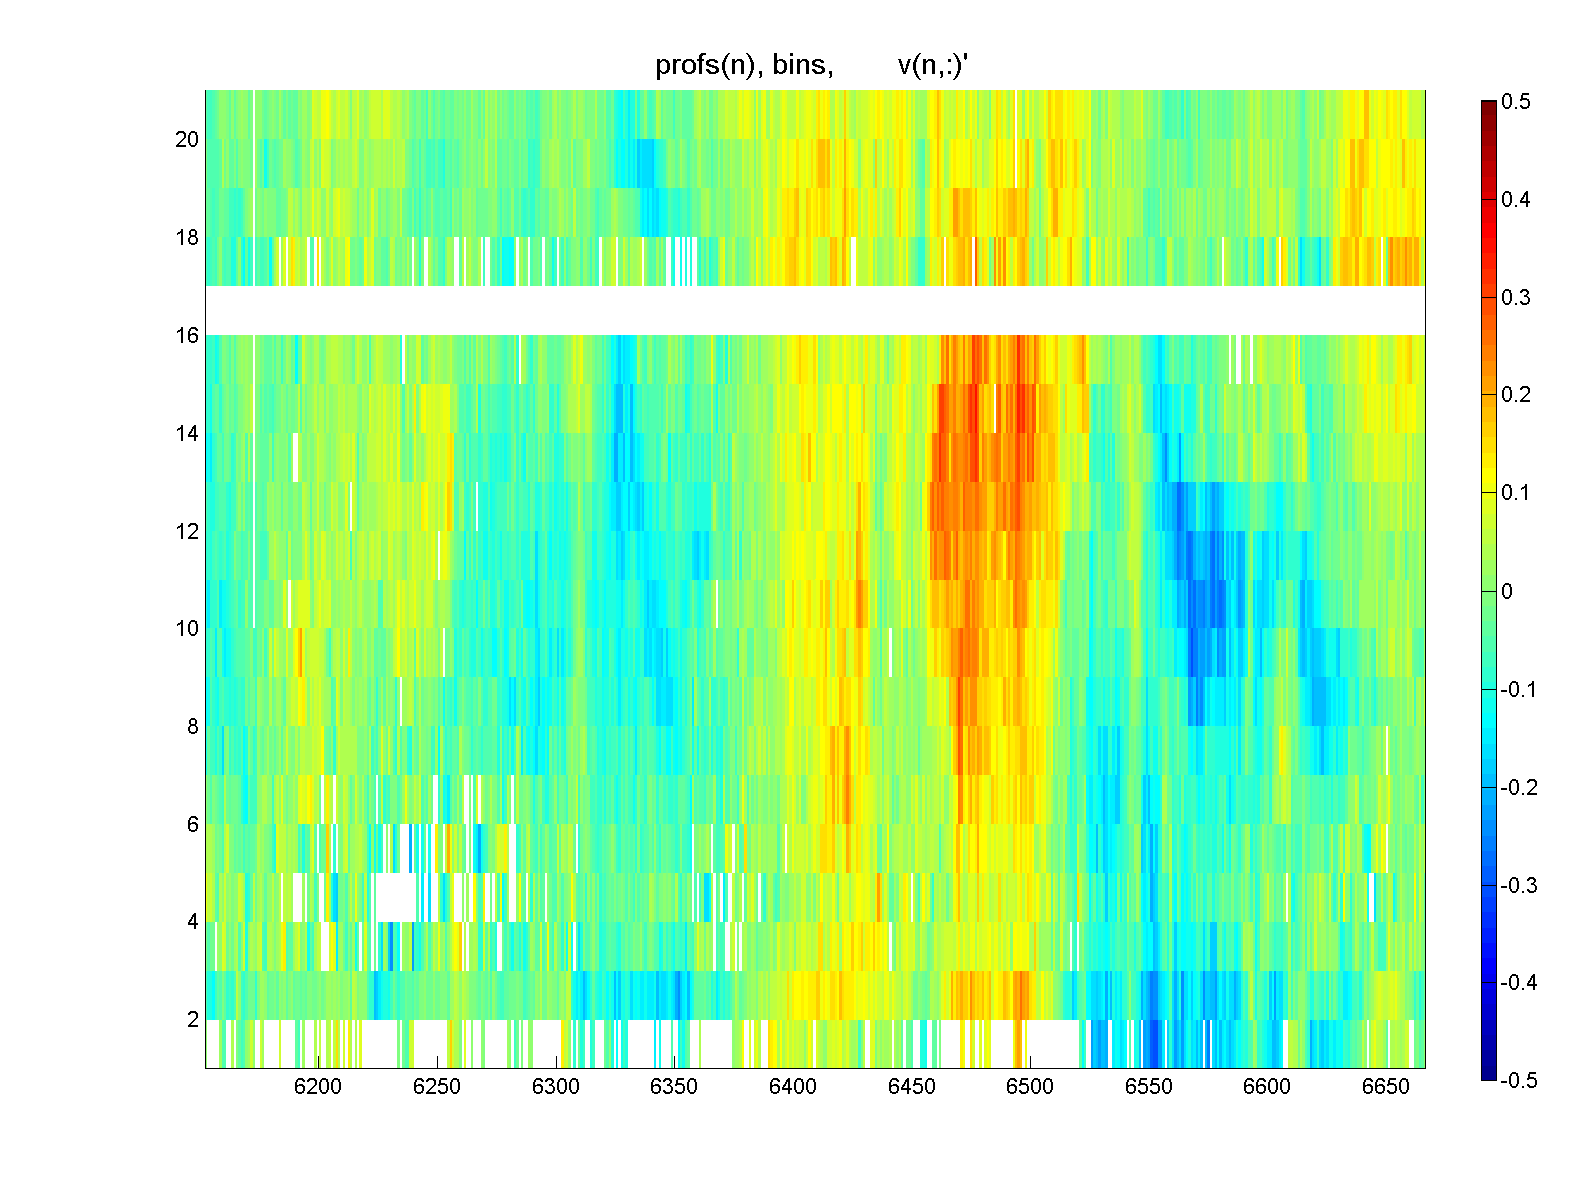
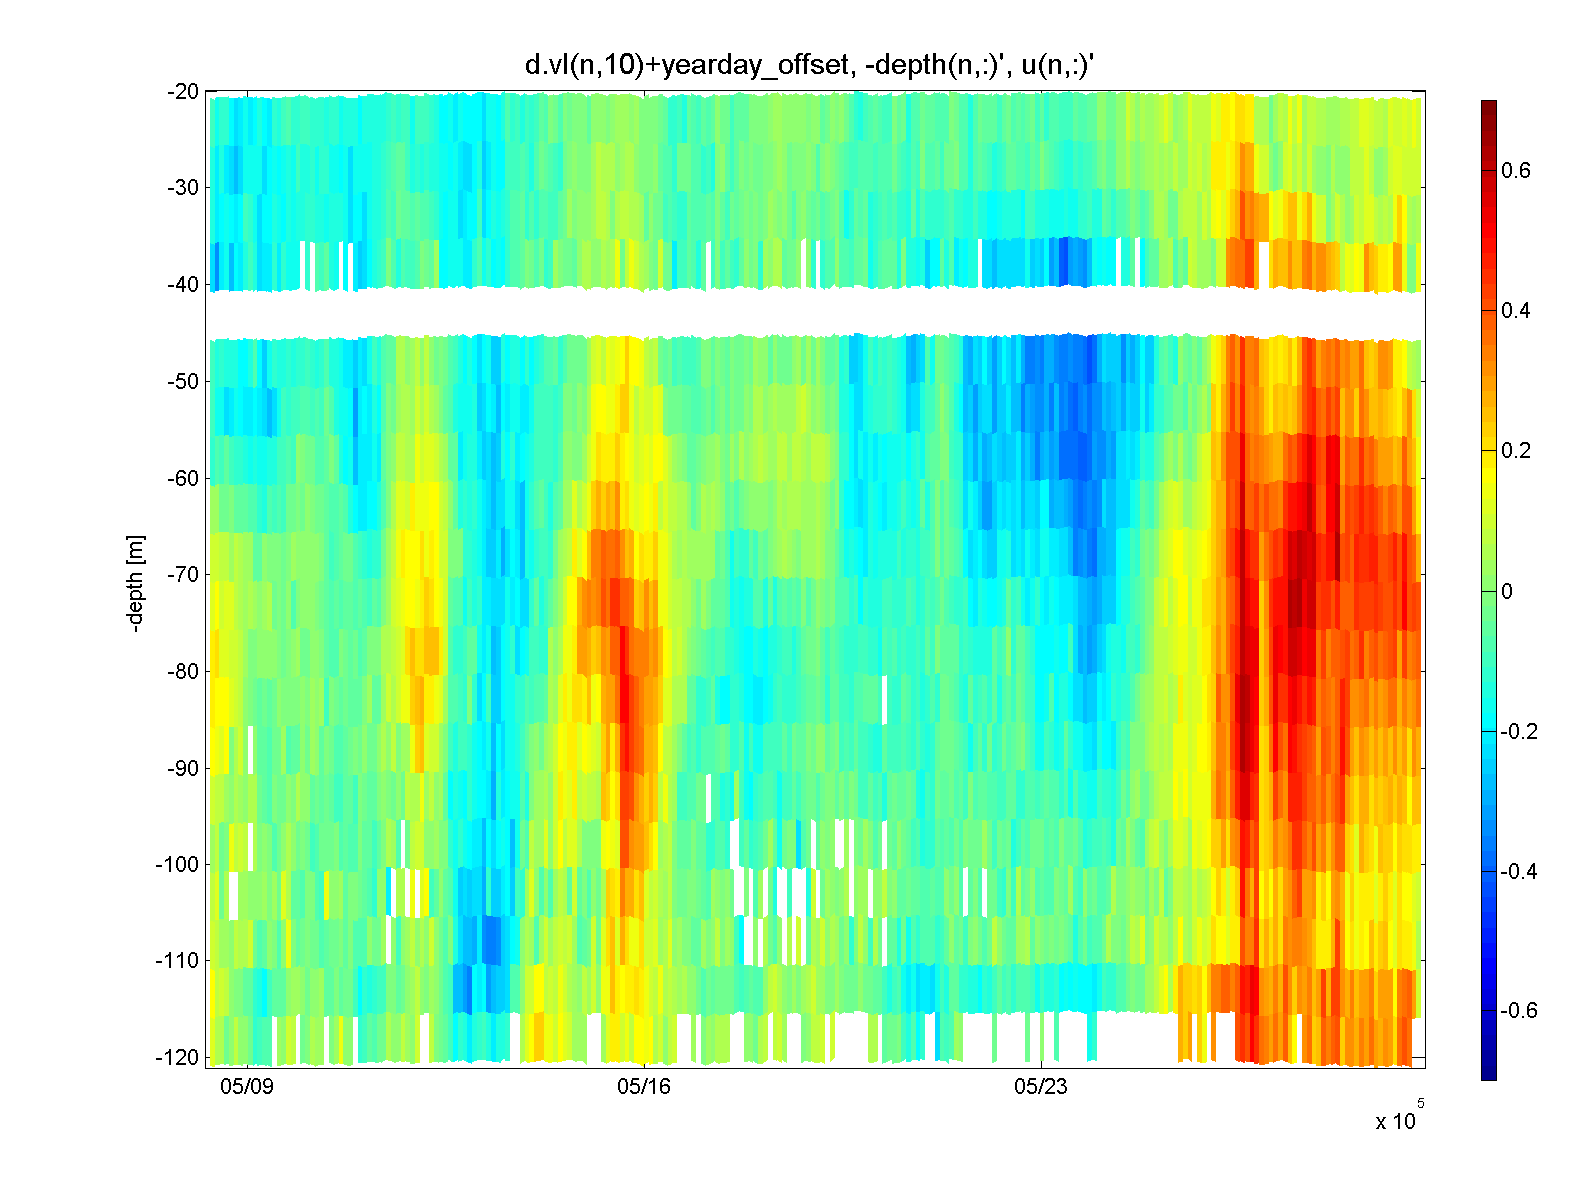
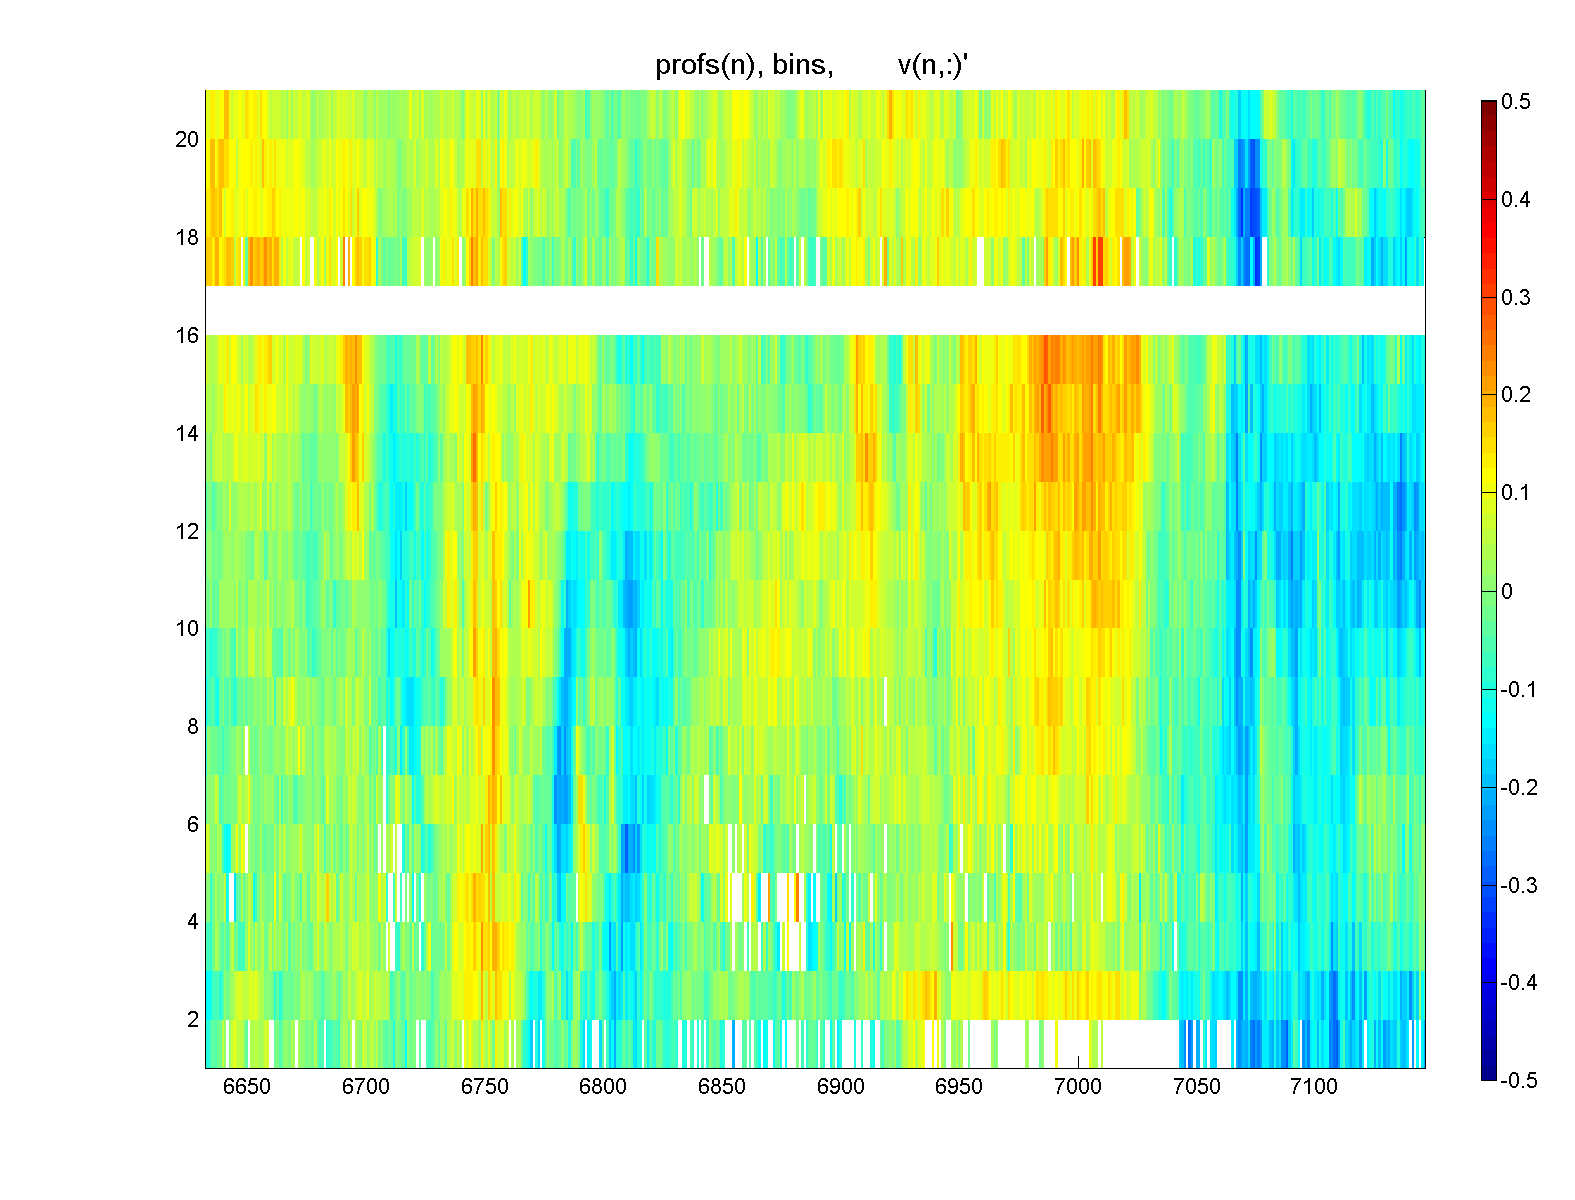
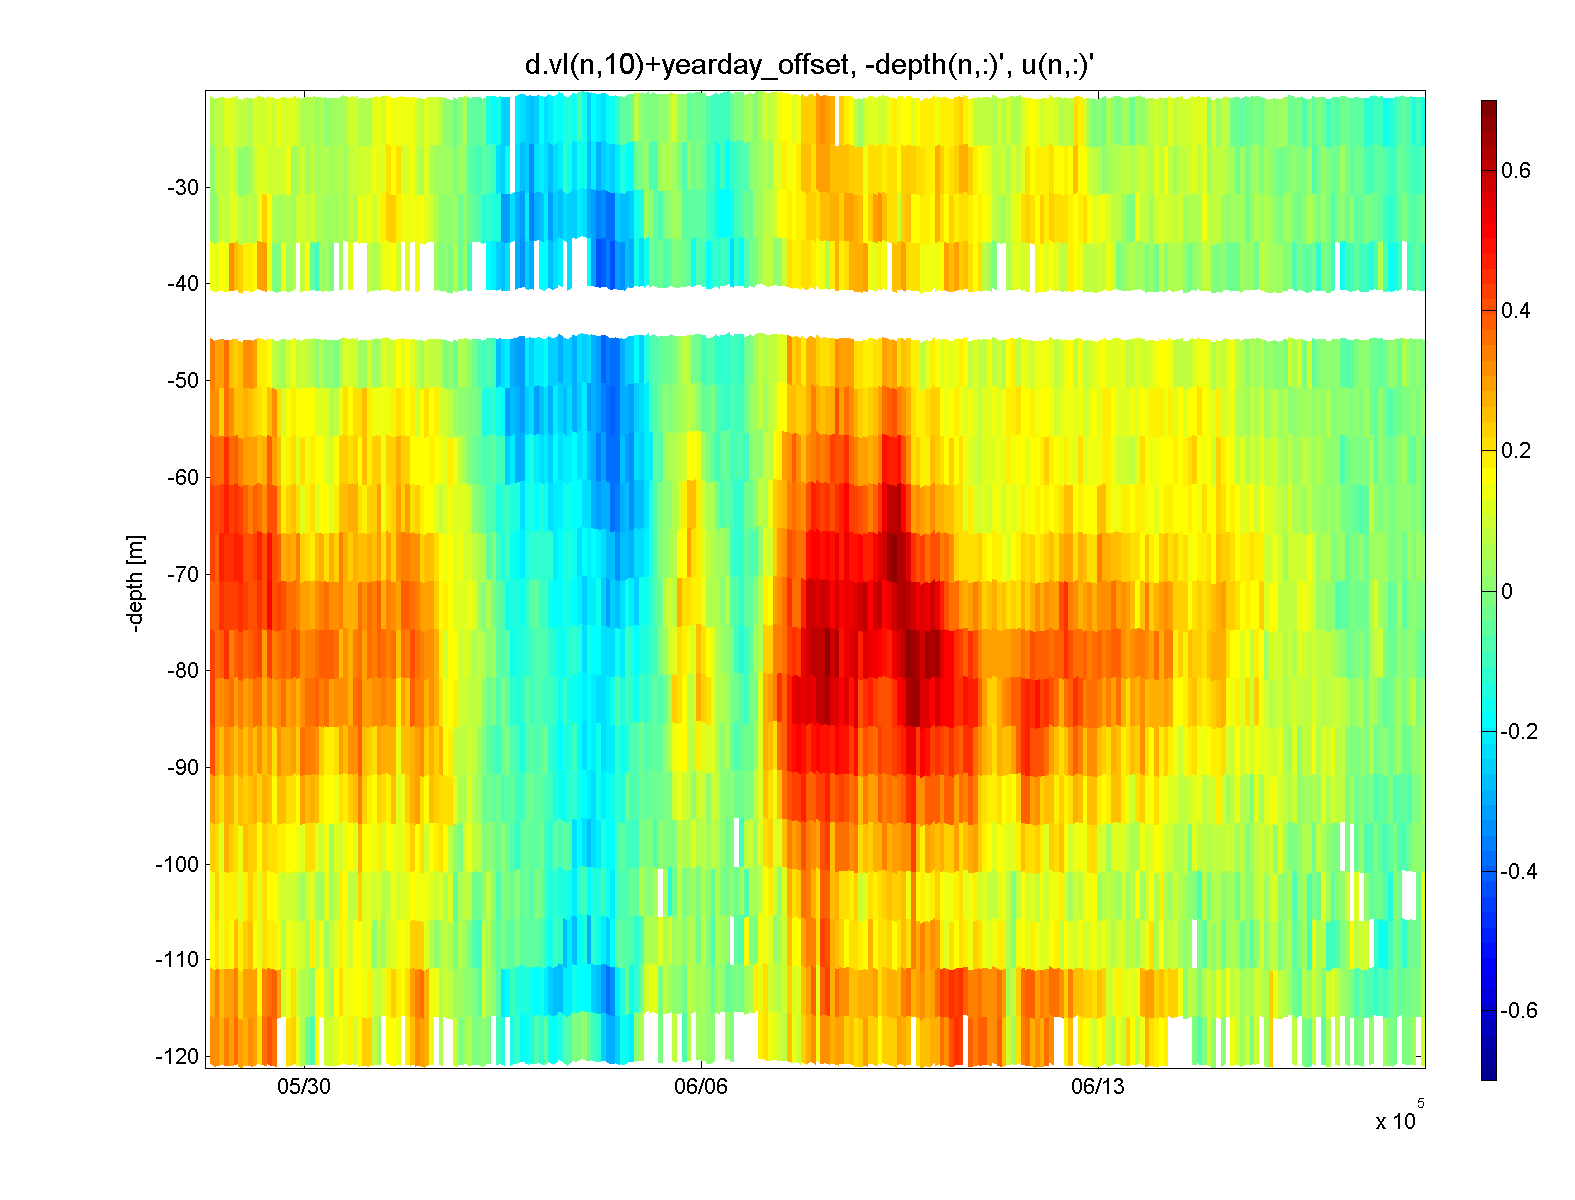
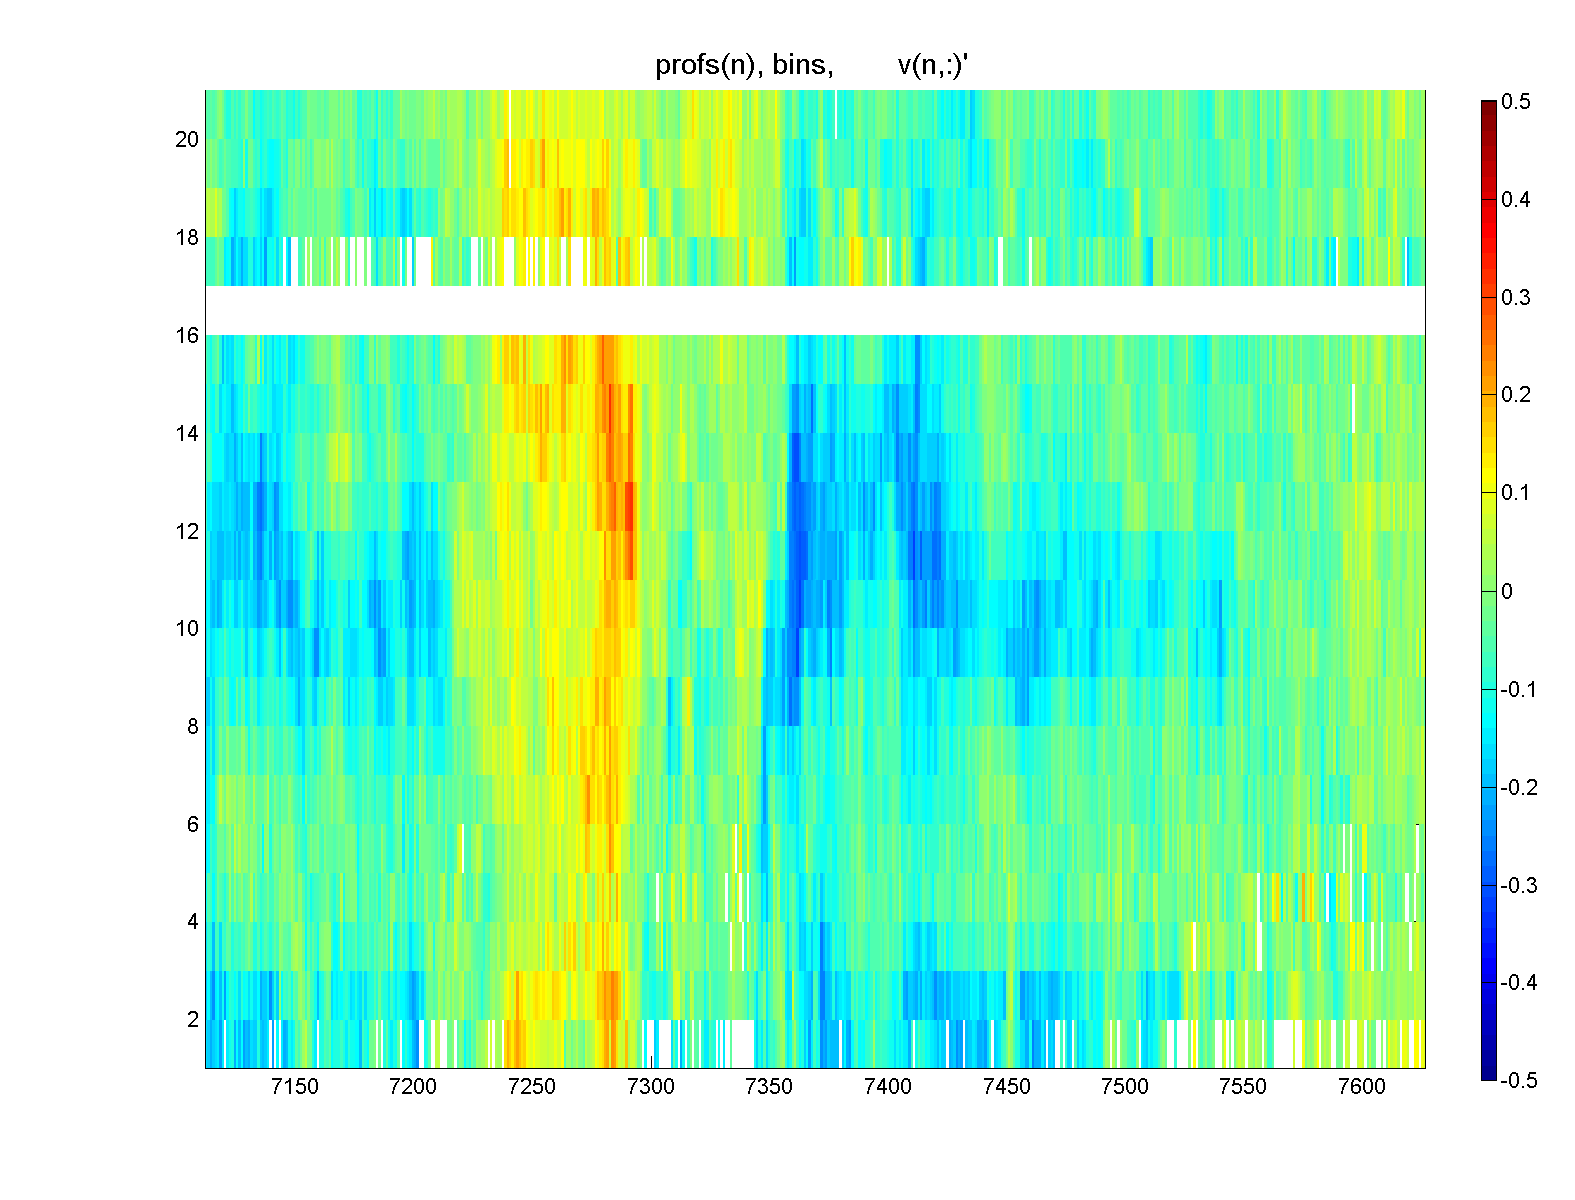
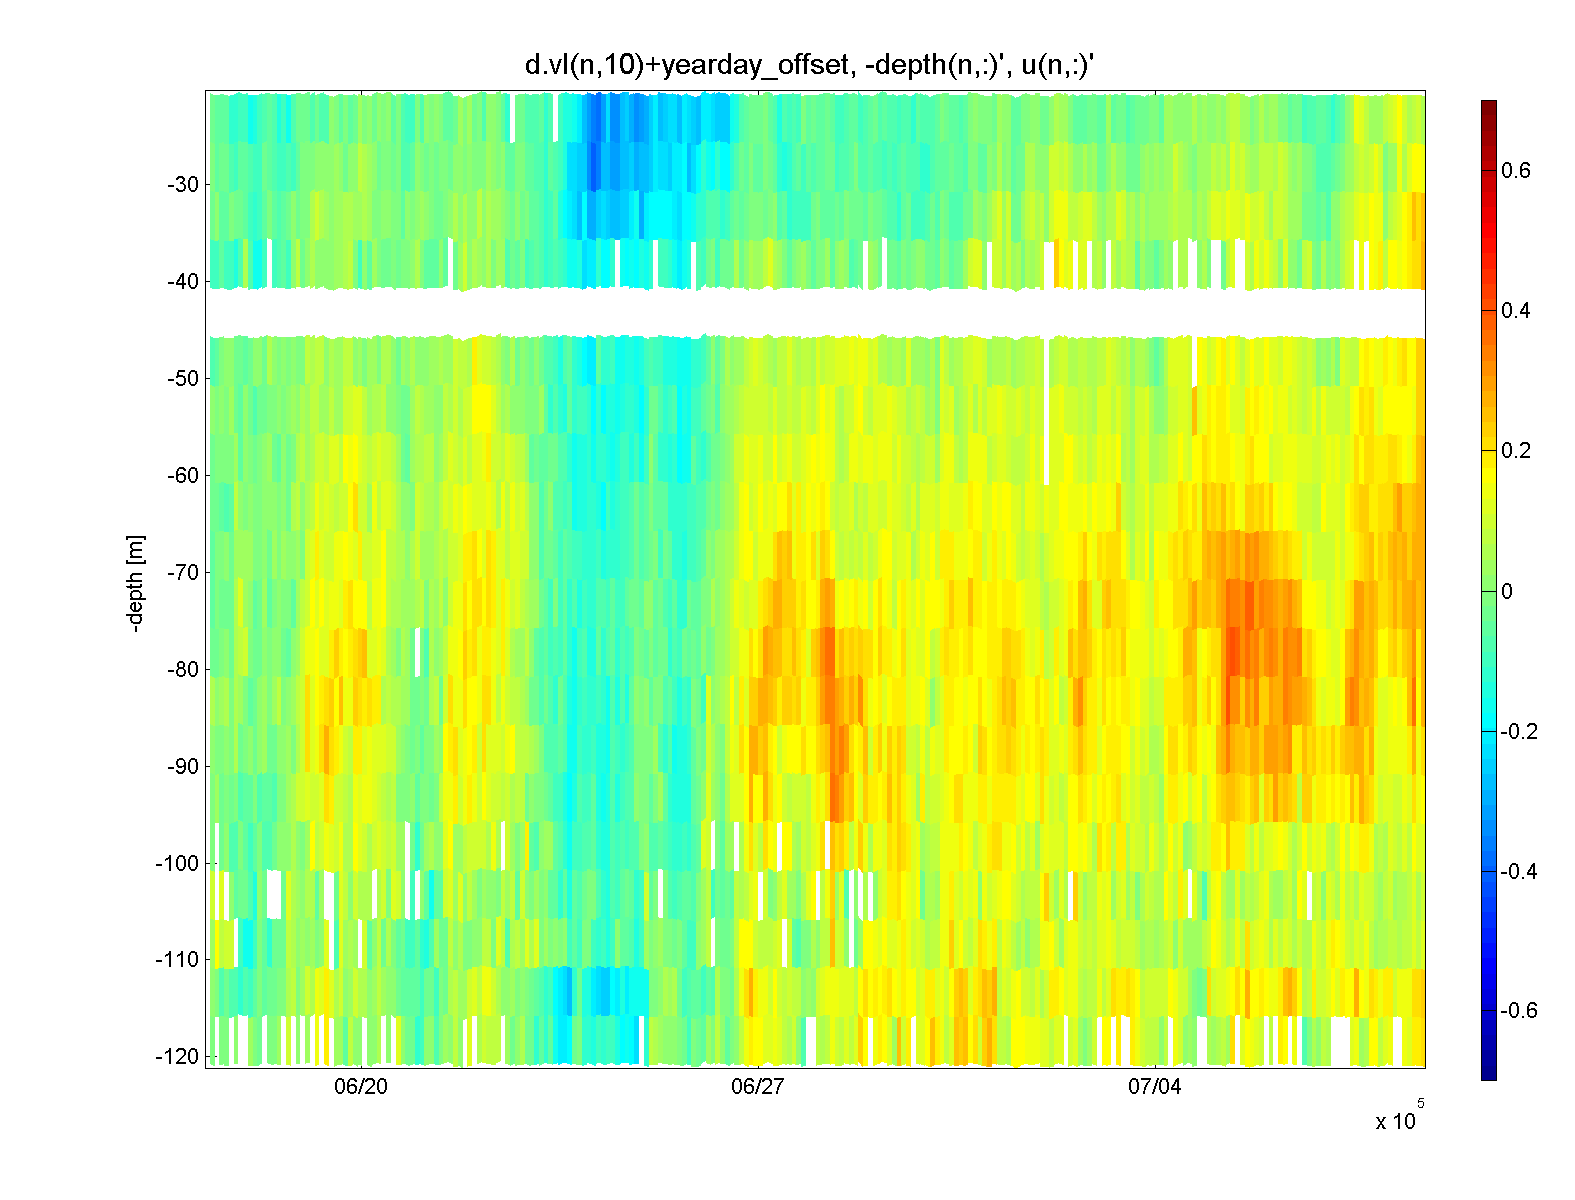
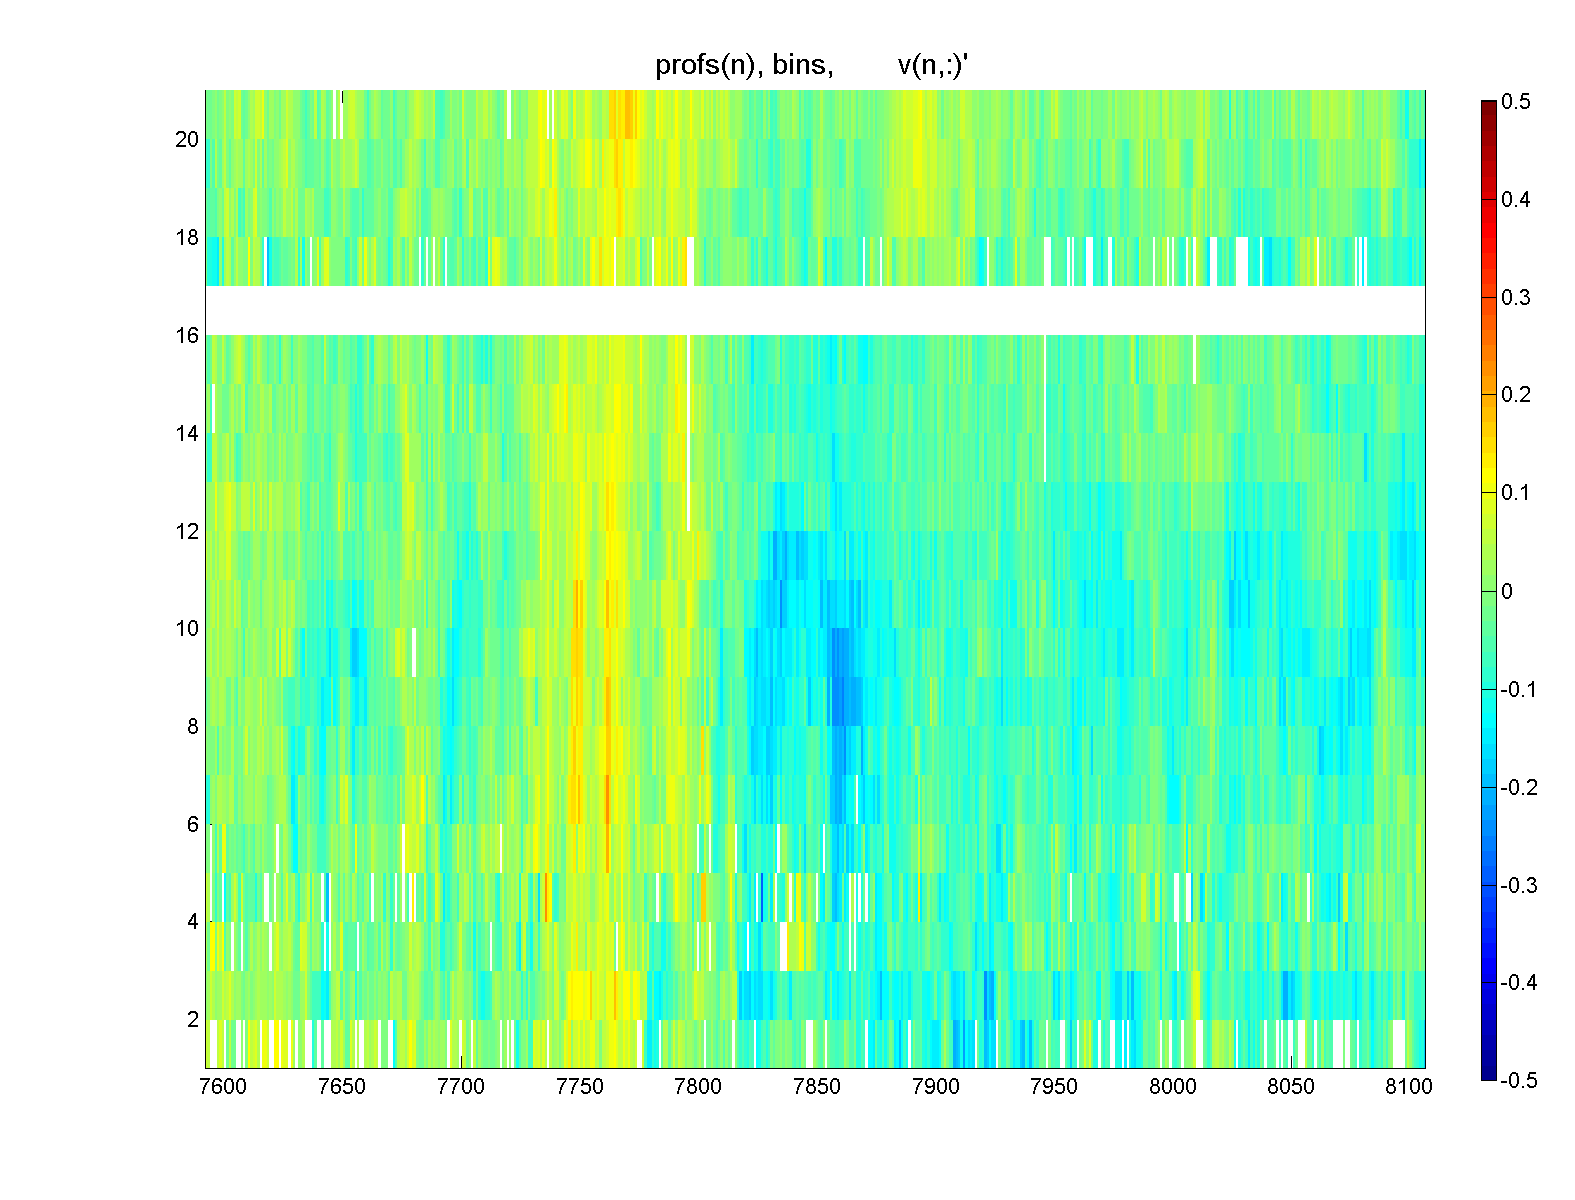
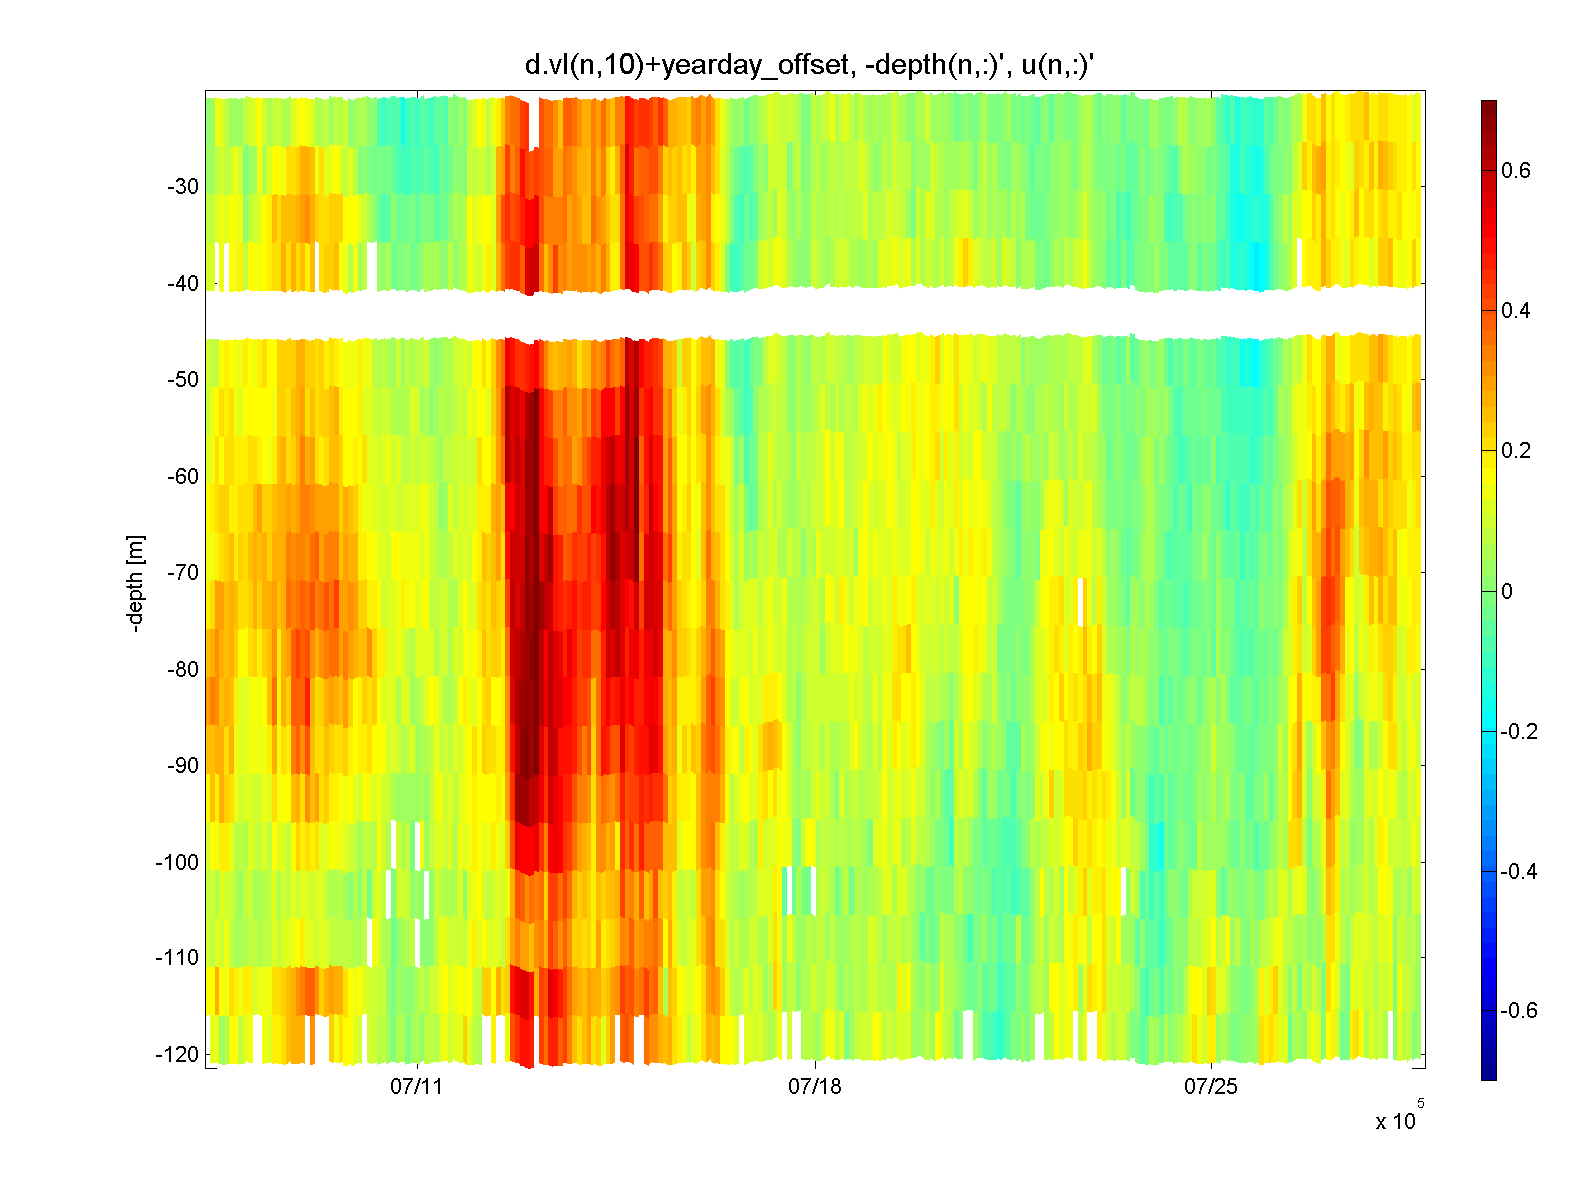
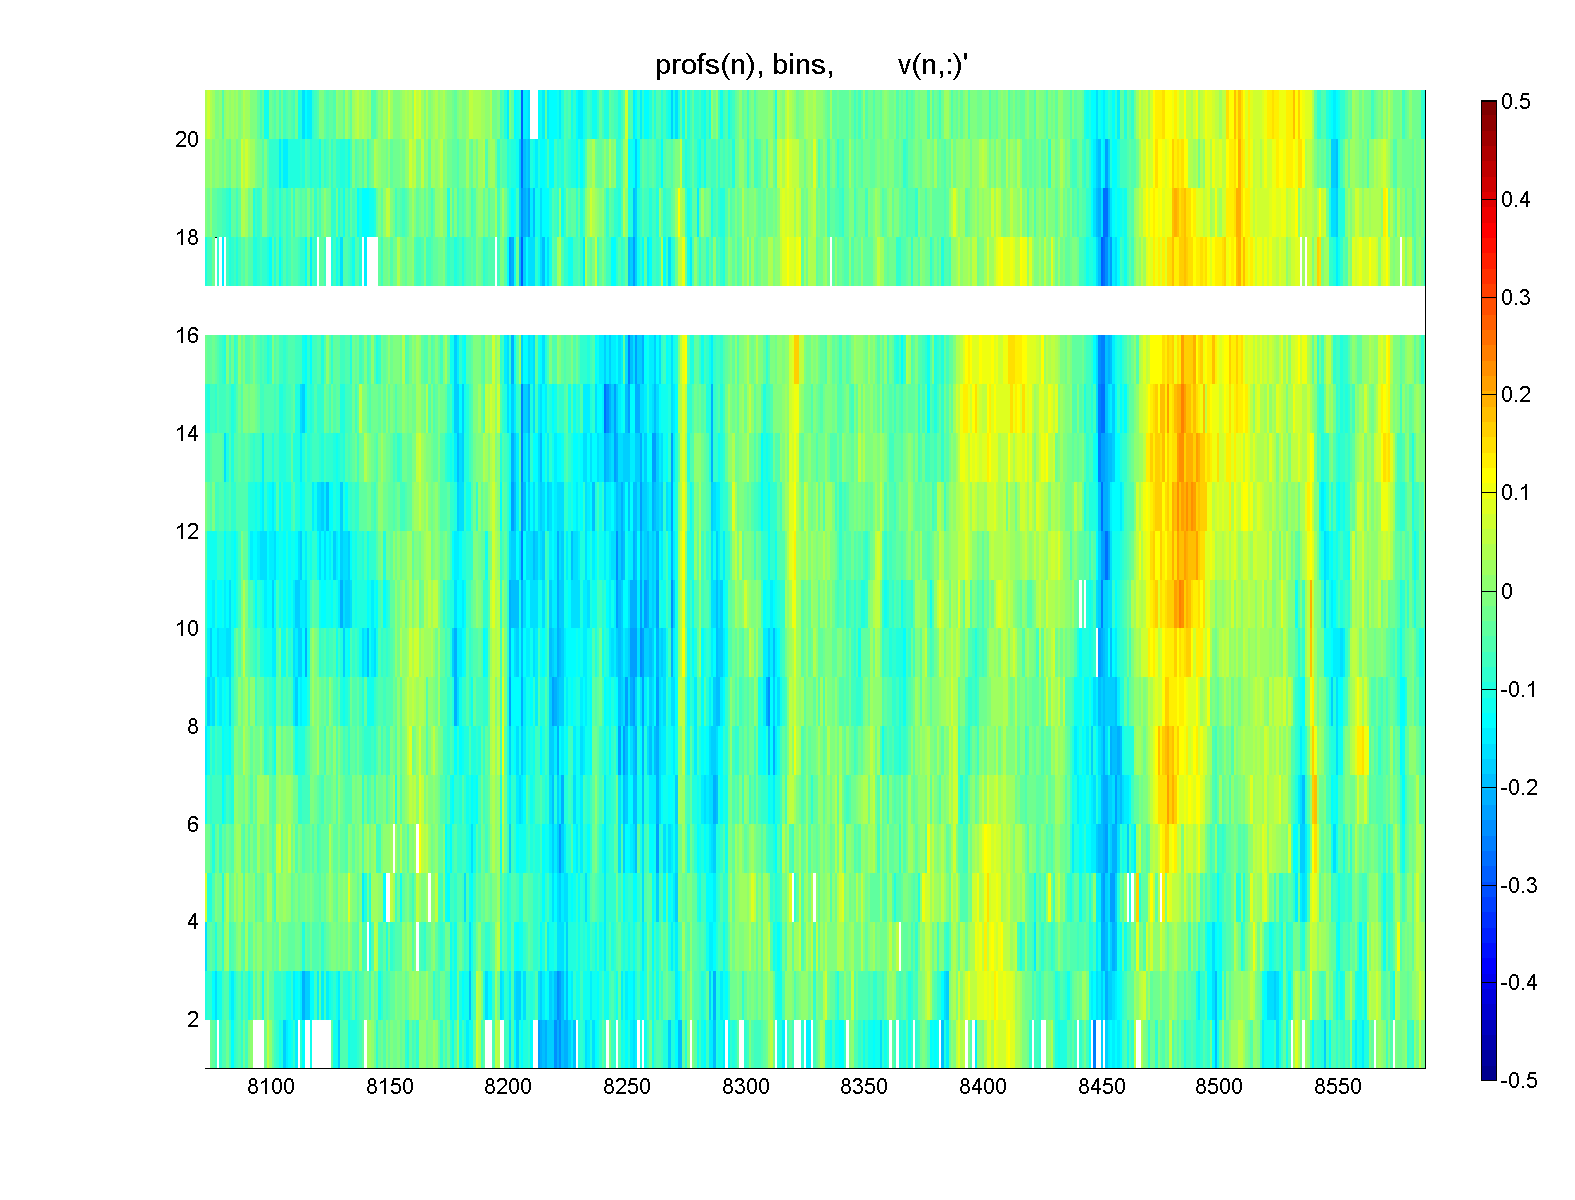
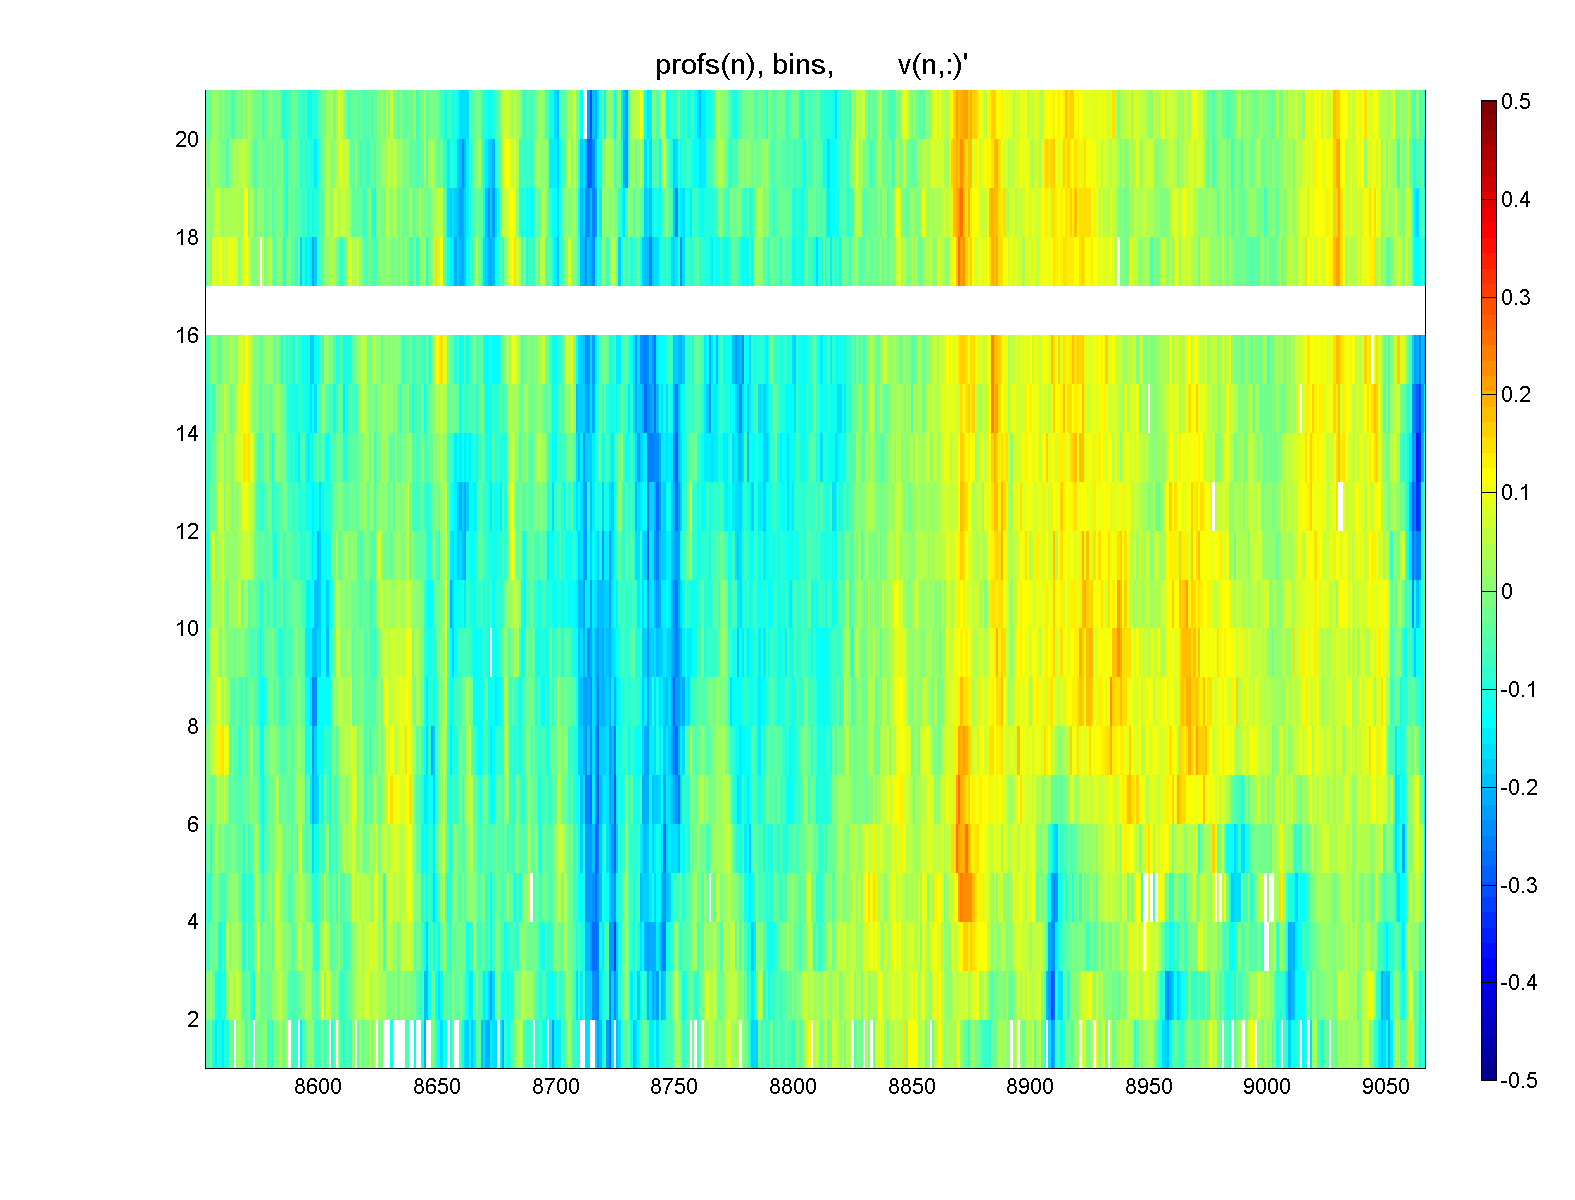
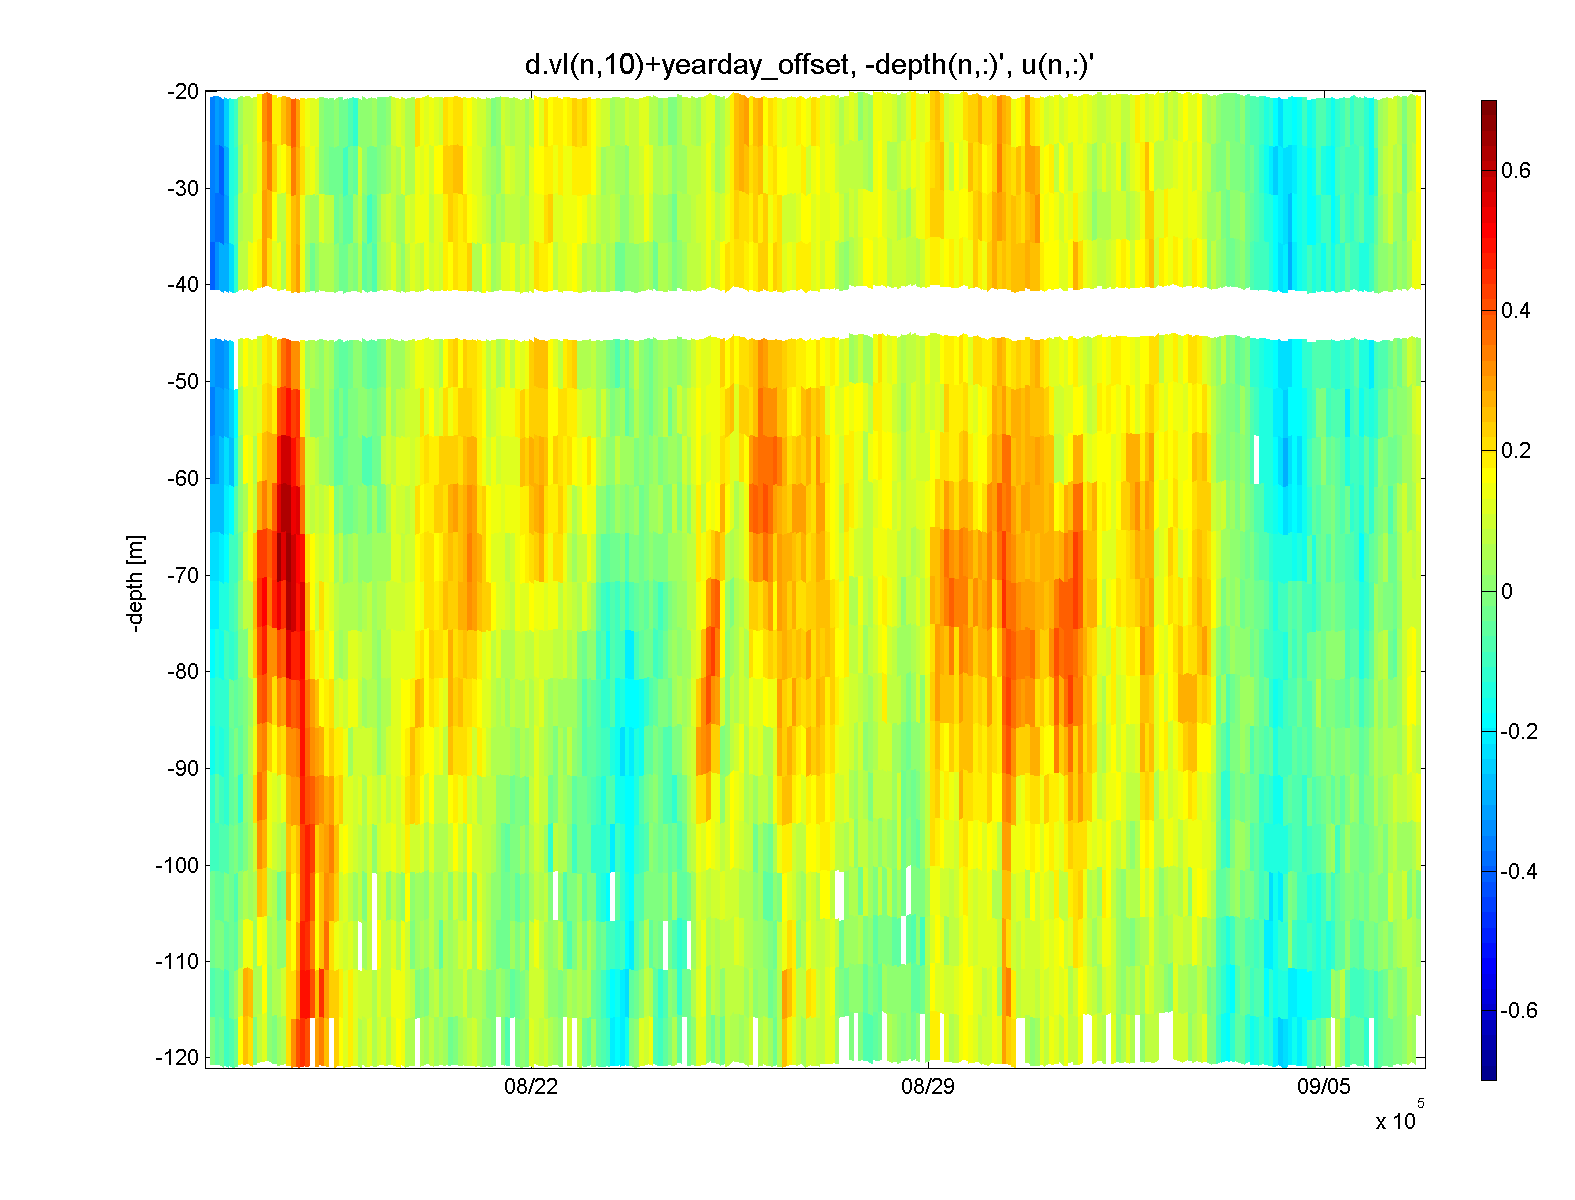
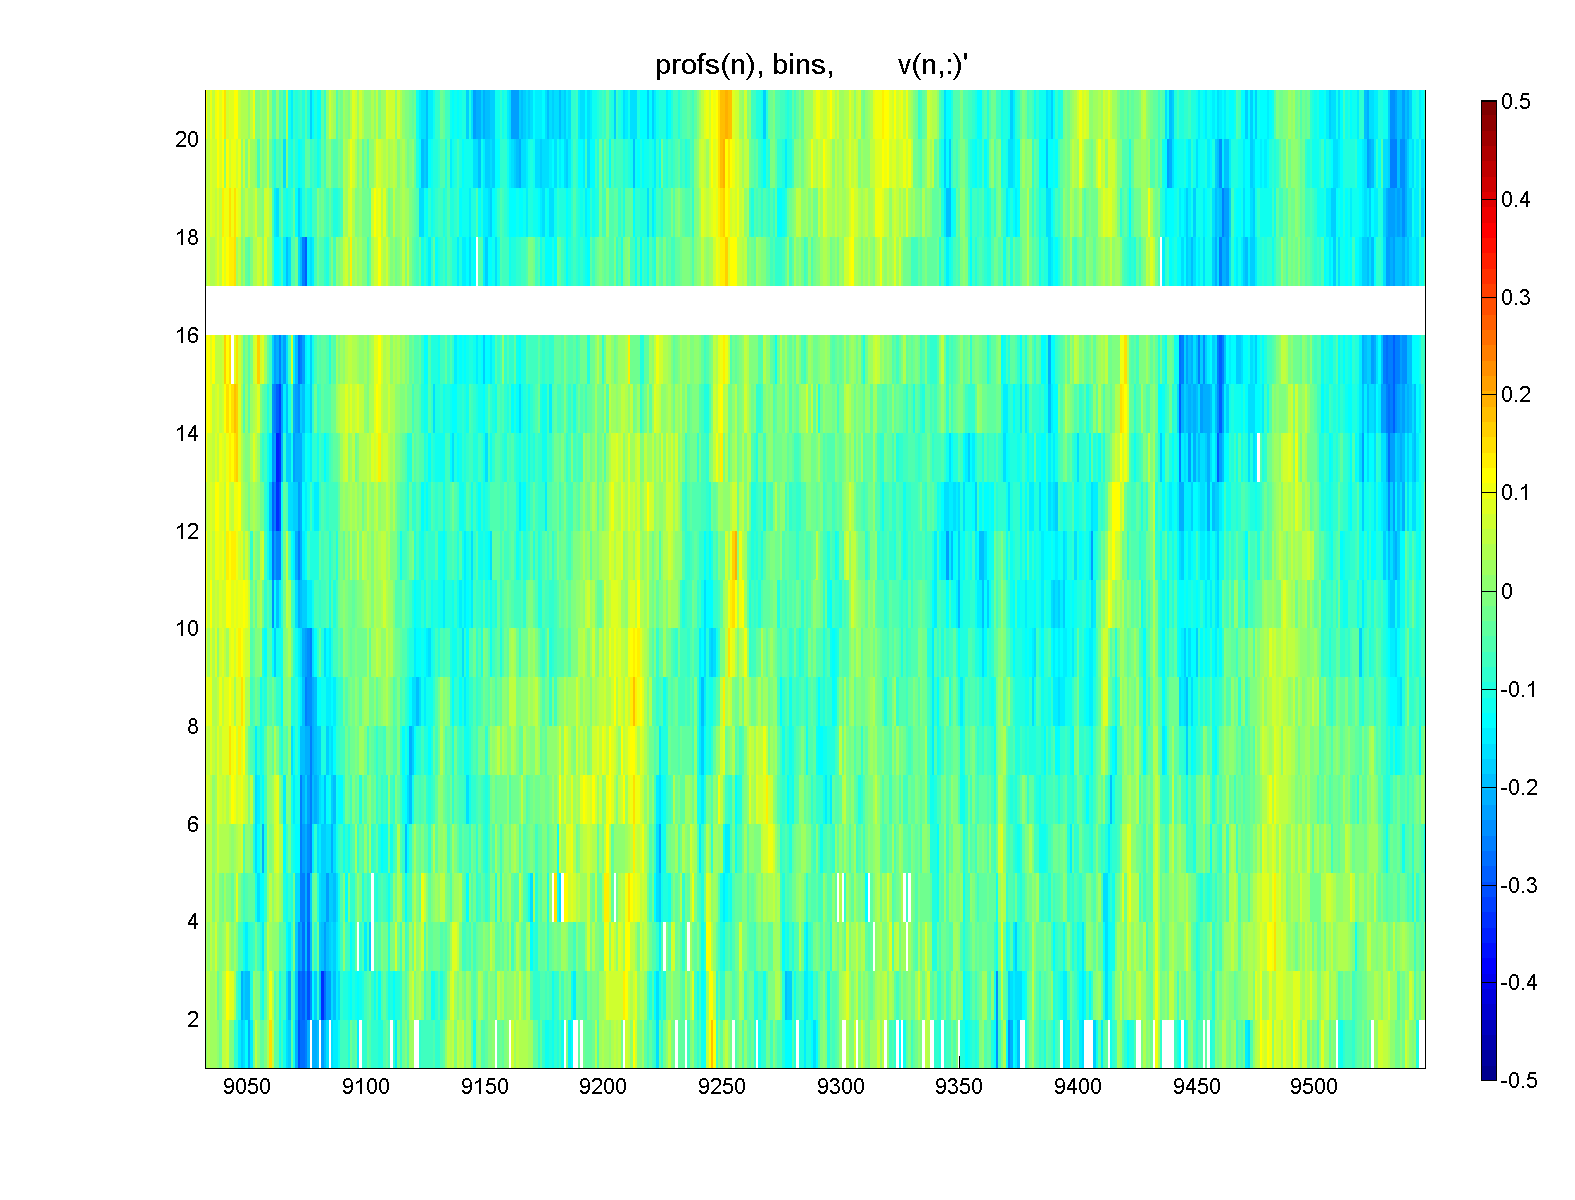
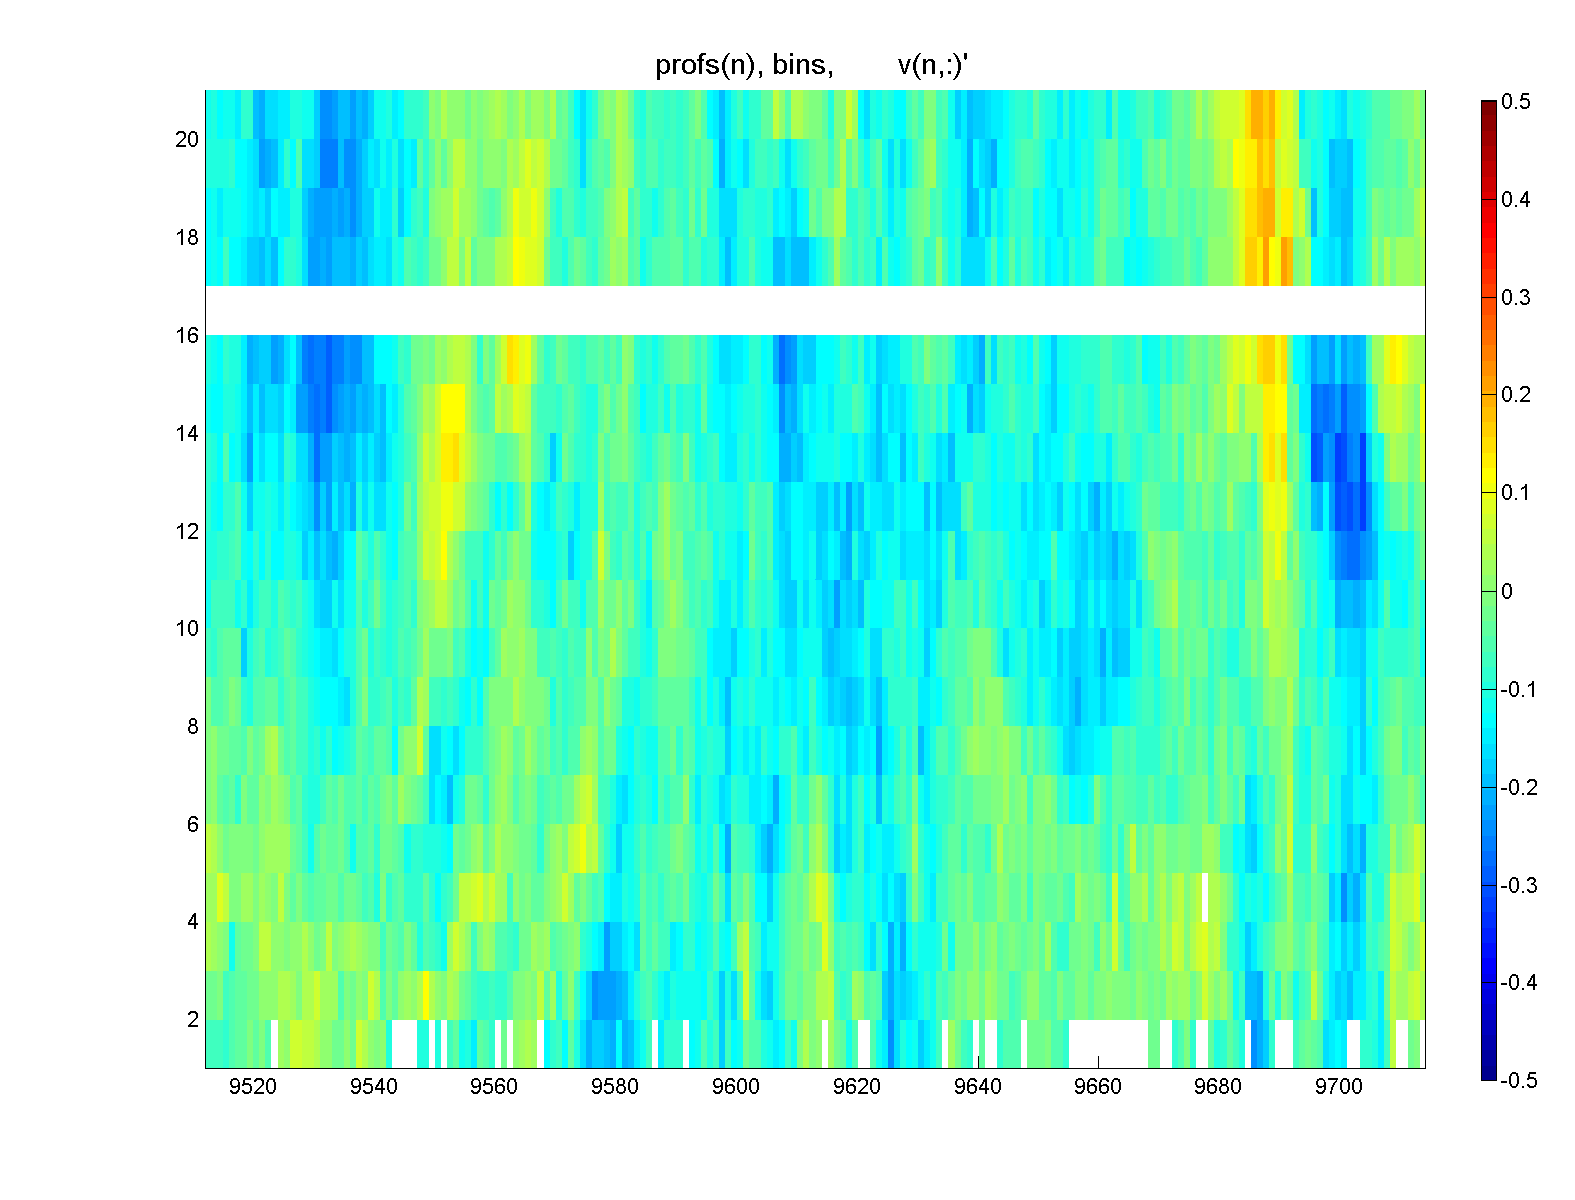
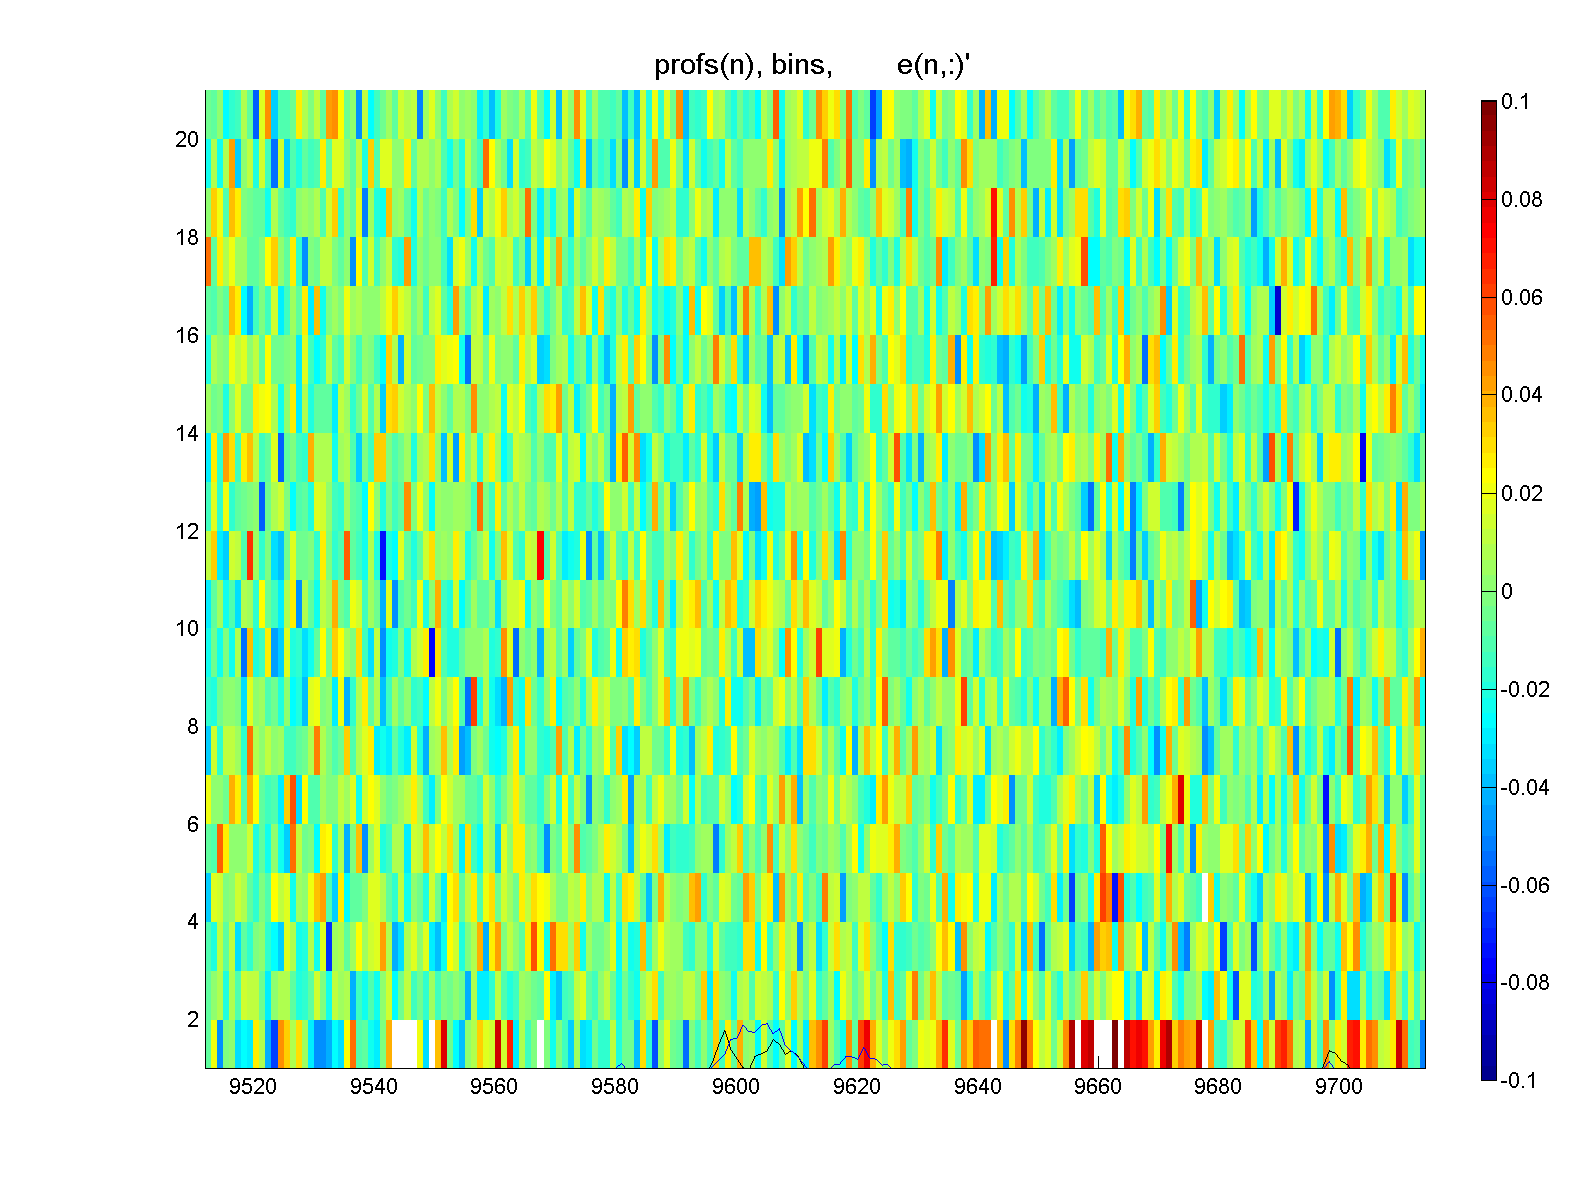
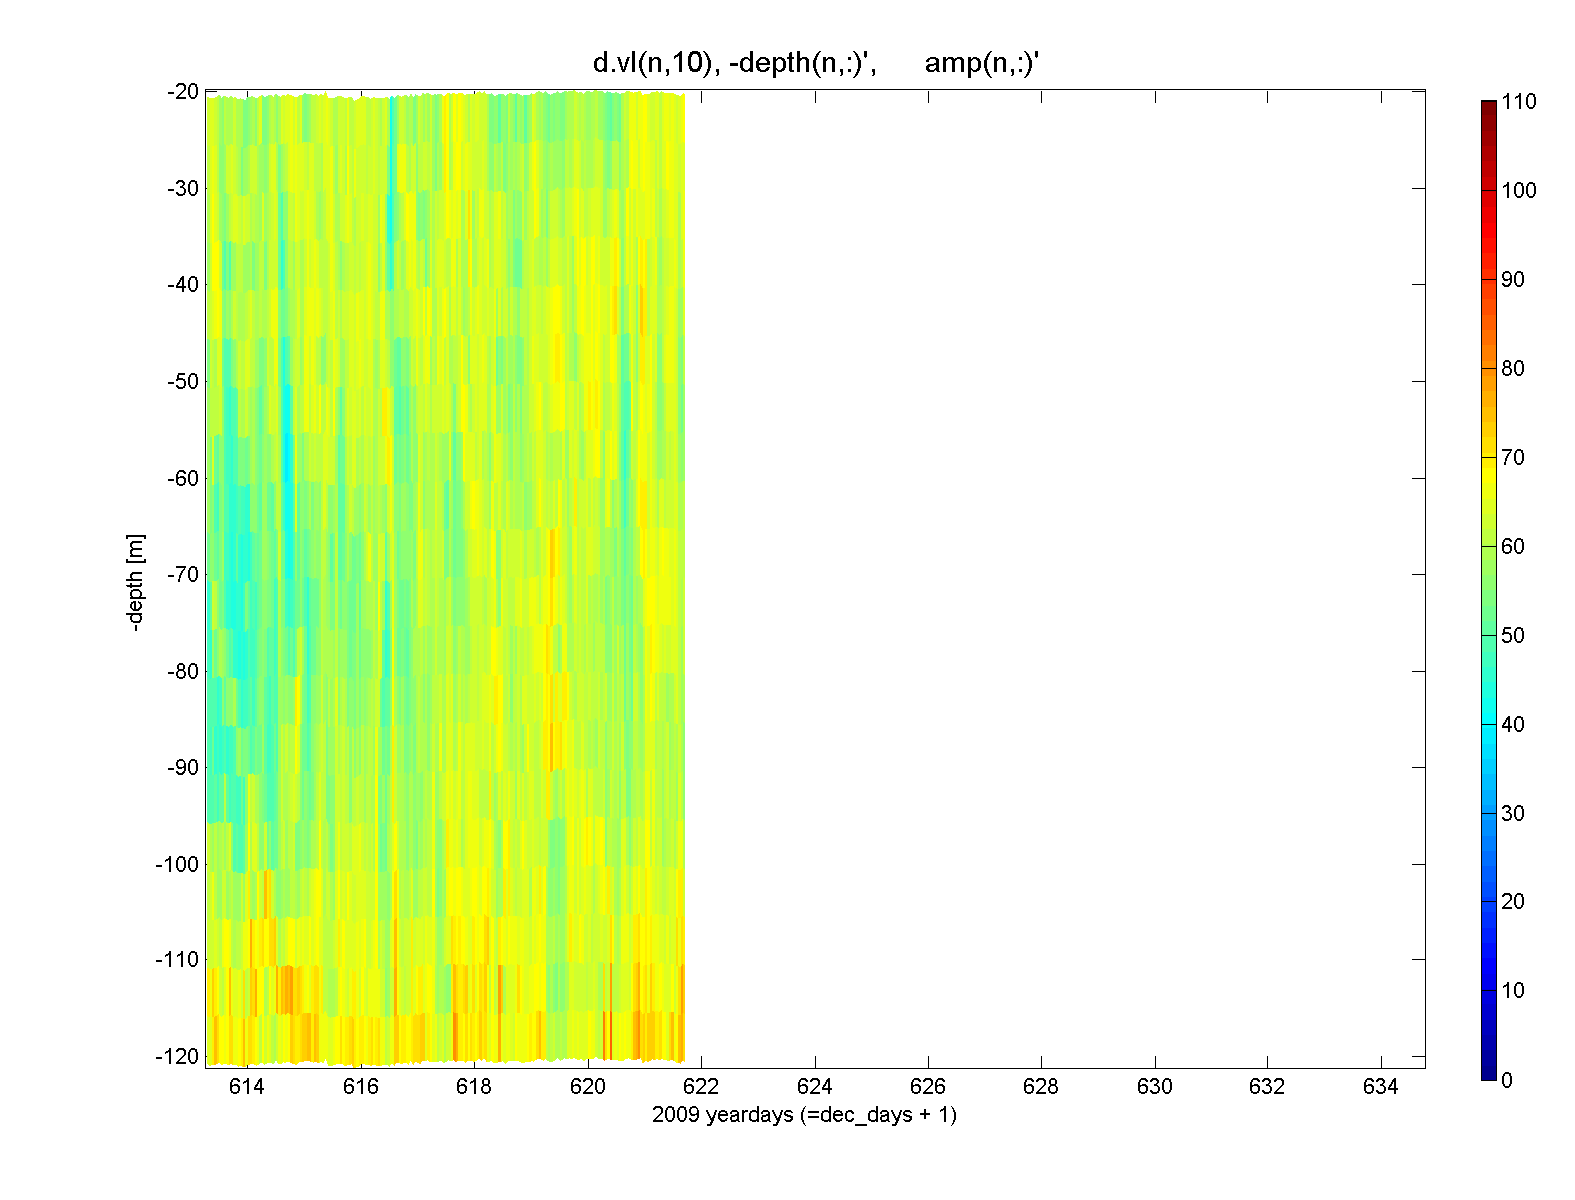
20-day time series of zonal (u), meridional (v), and
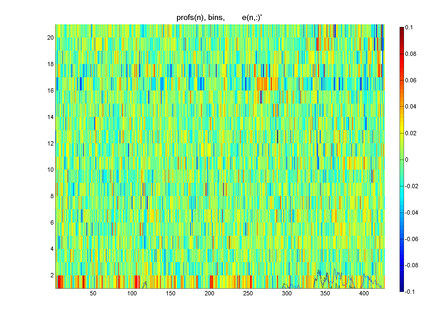
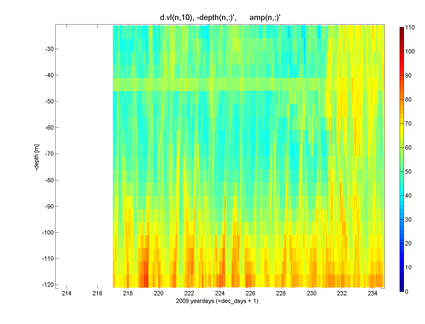
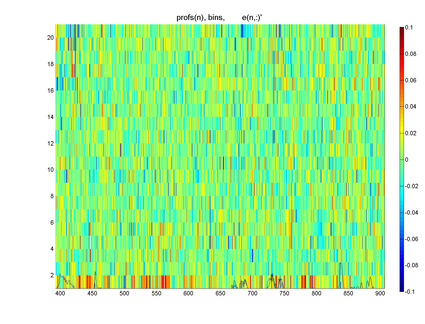
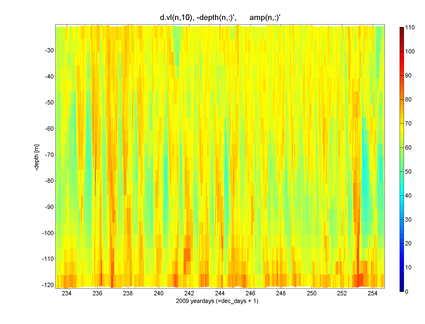
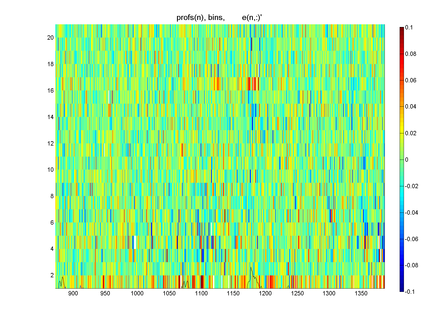
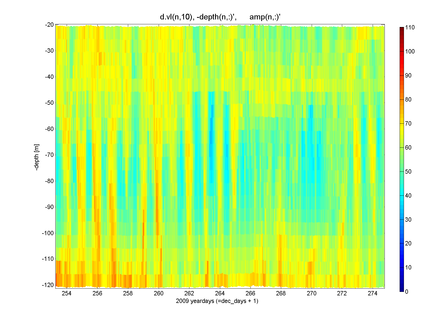
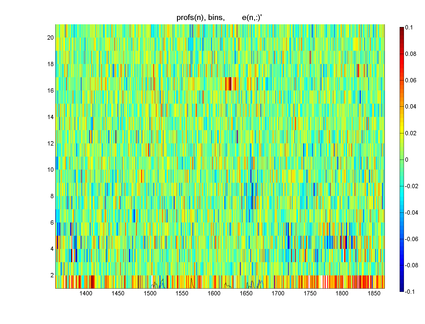
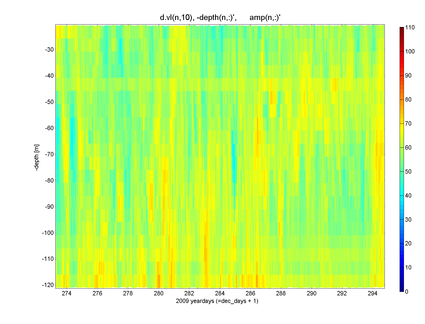
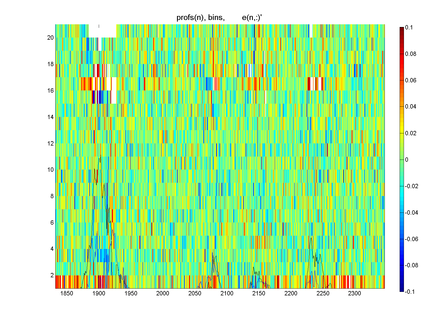
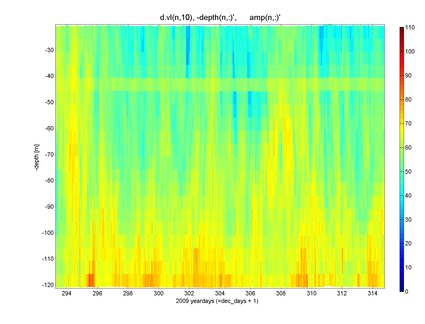
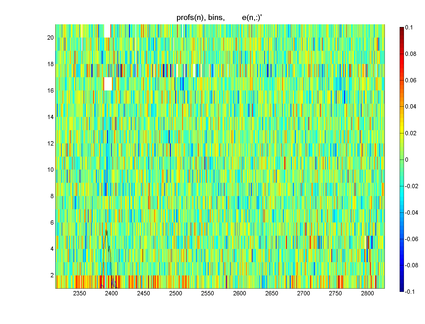
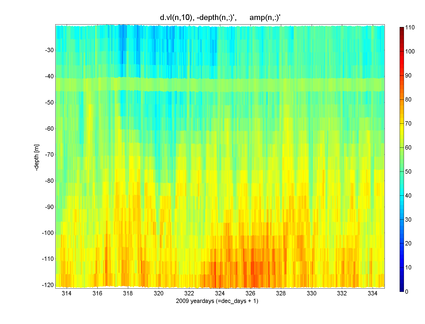
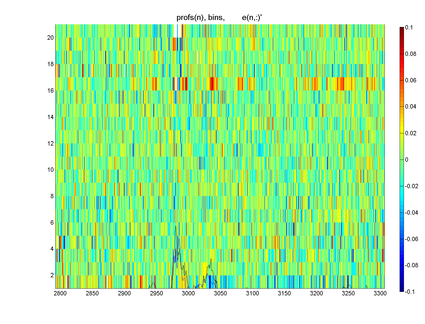
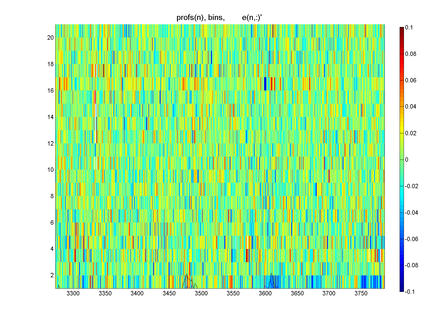
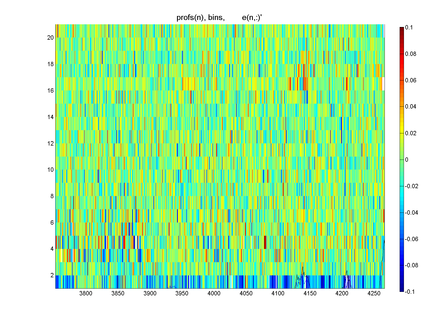
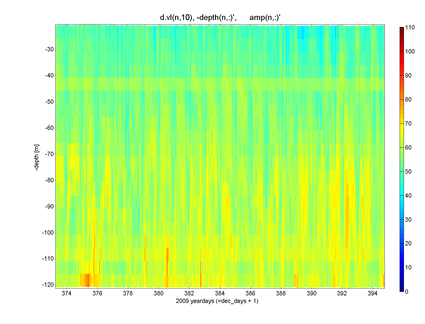
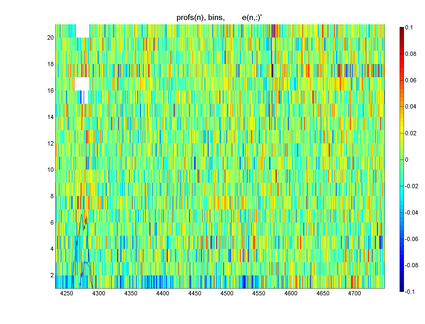
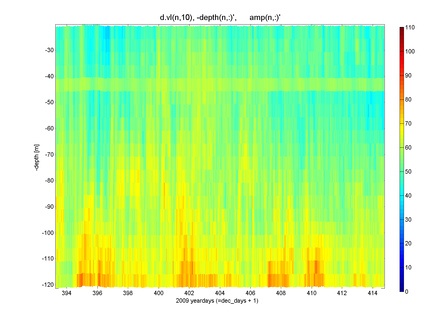
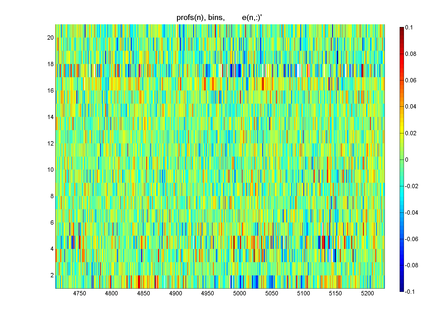
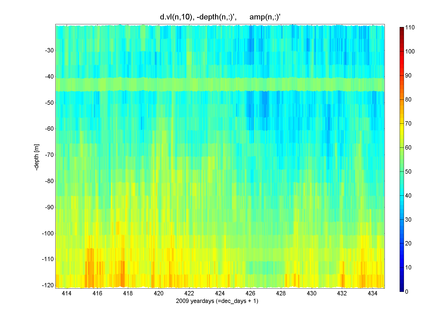
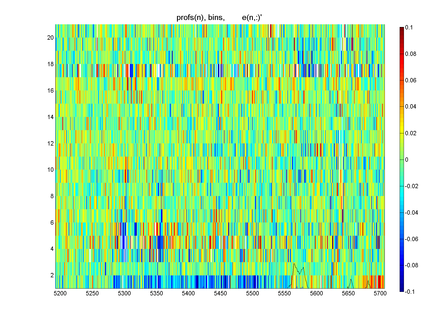
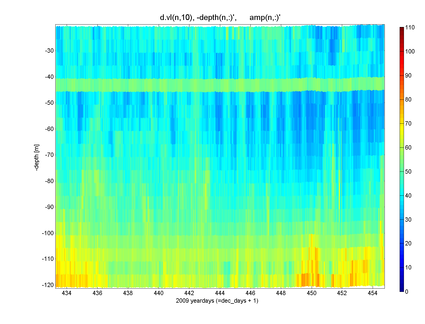
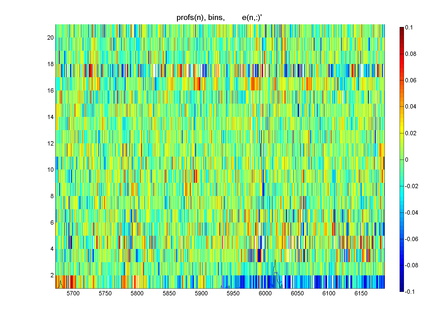
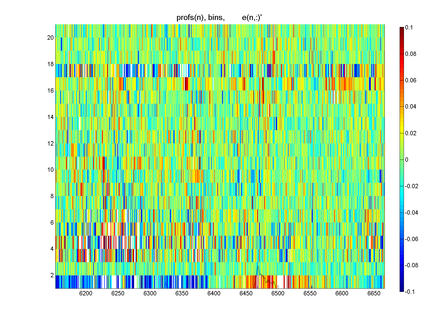
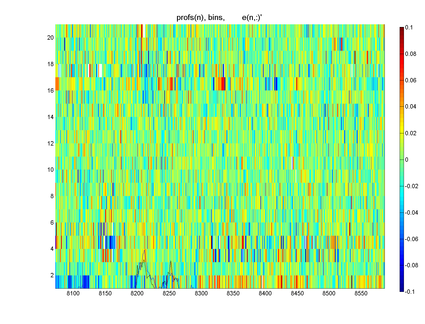
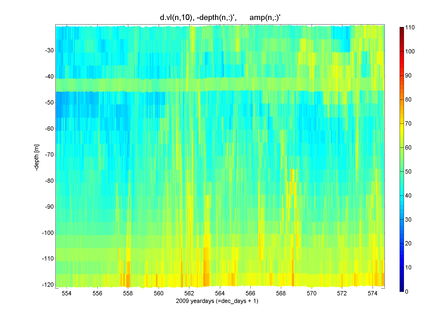
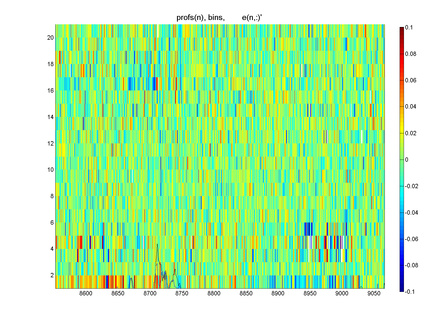
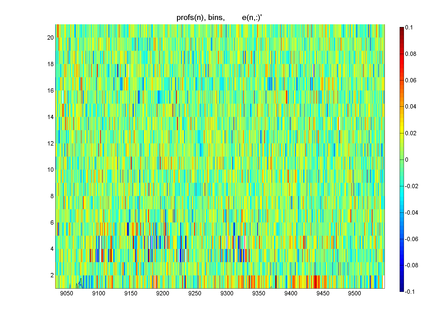
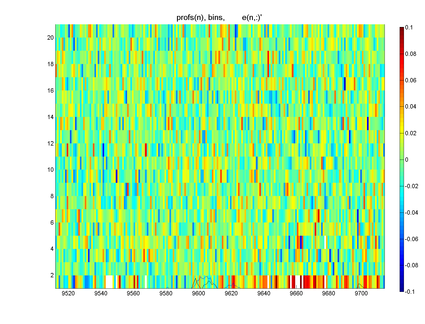
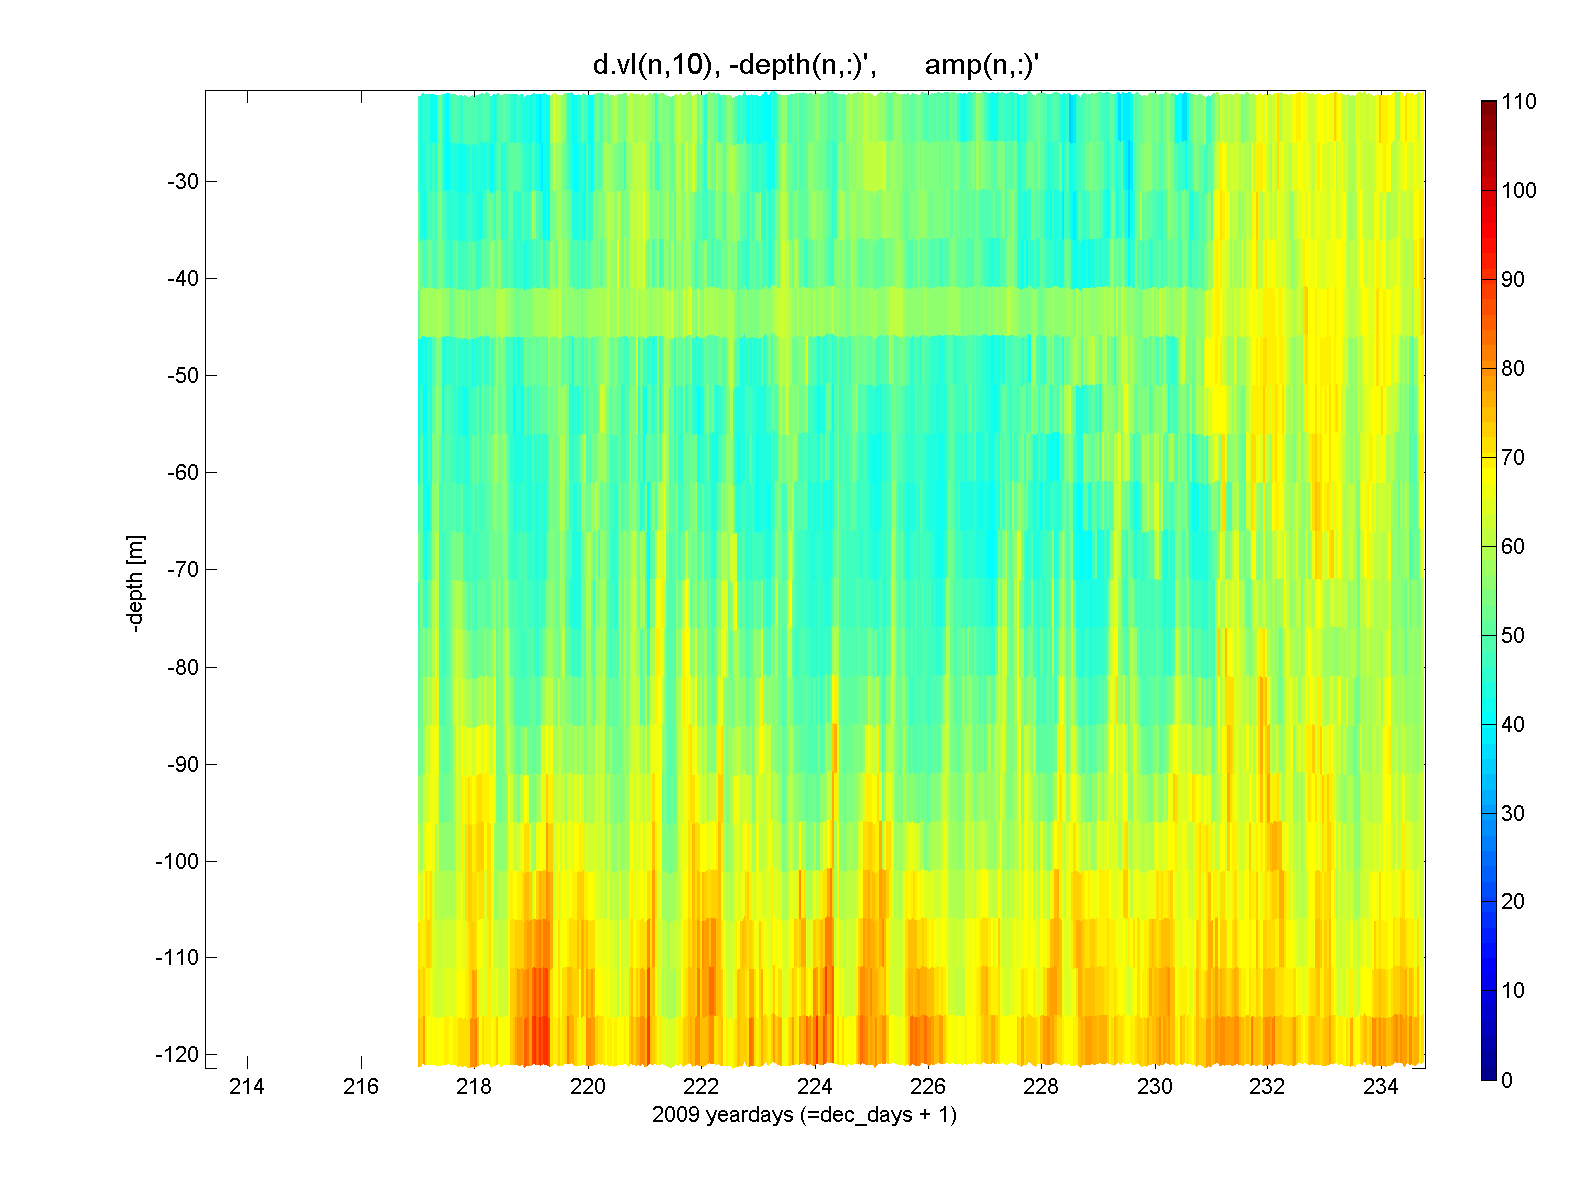
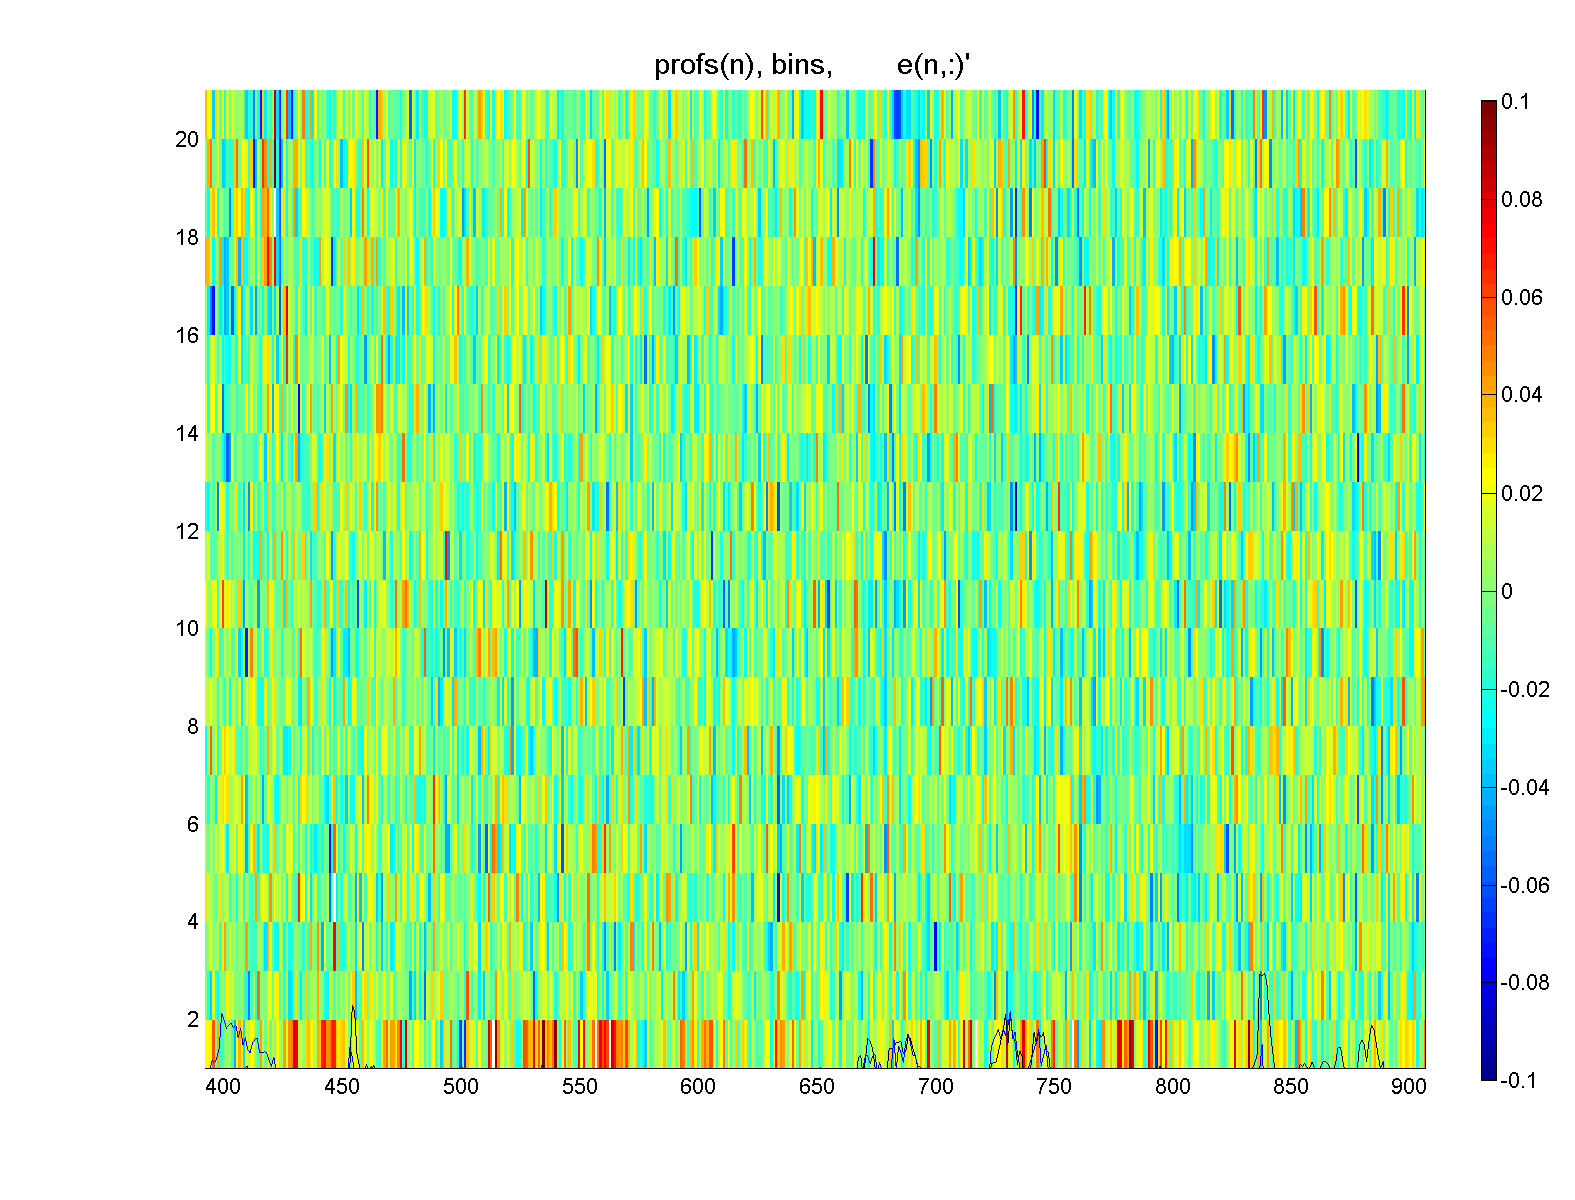
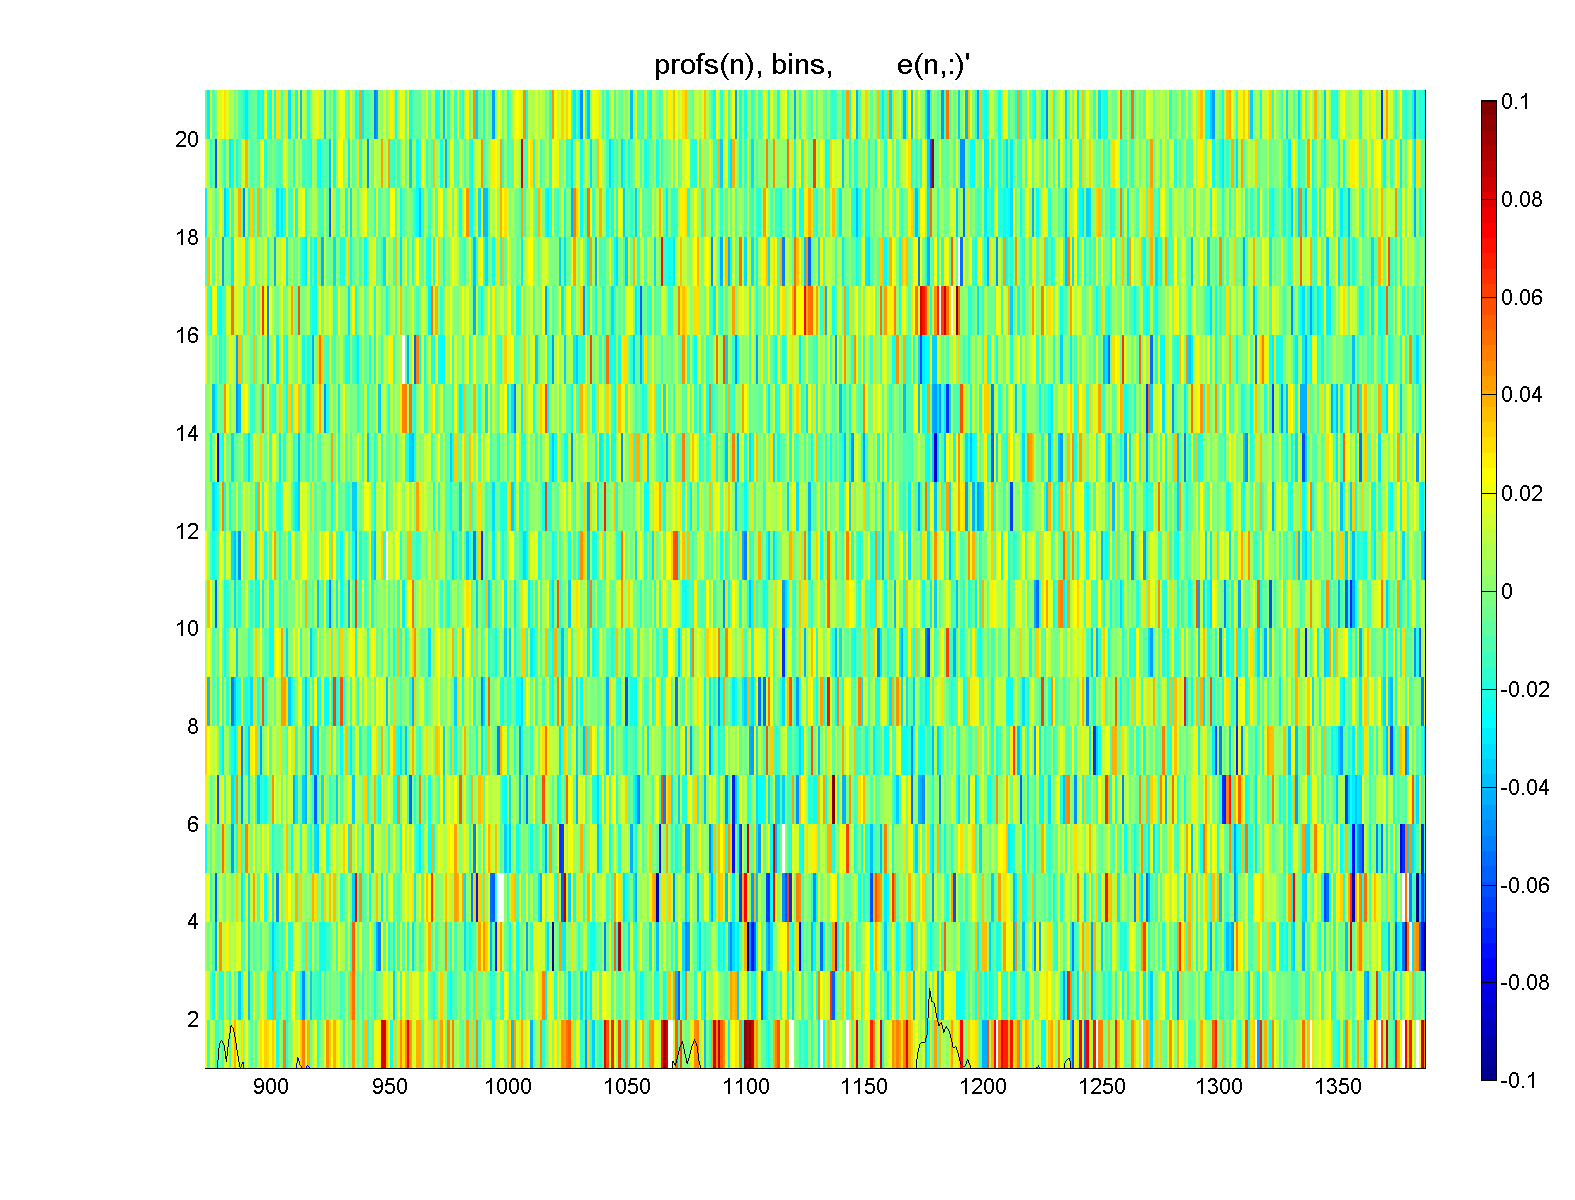
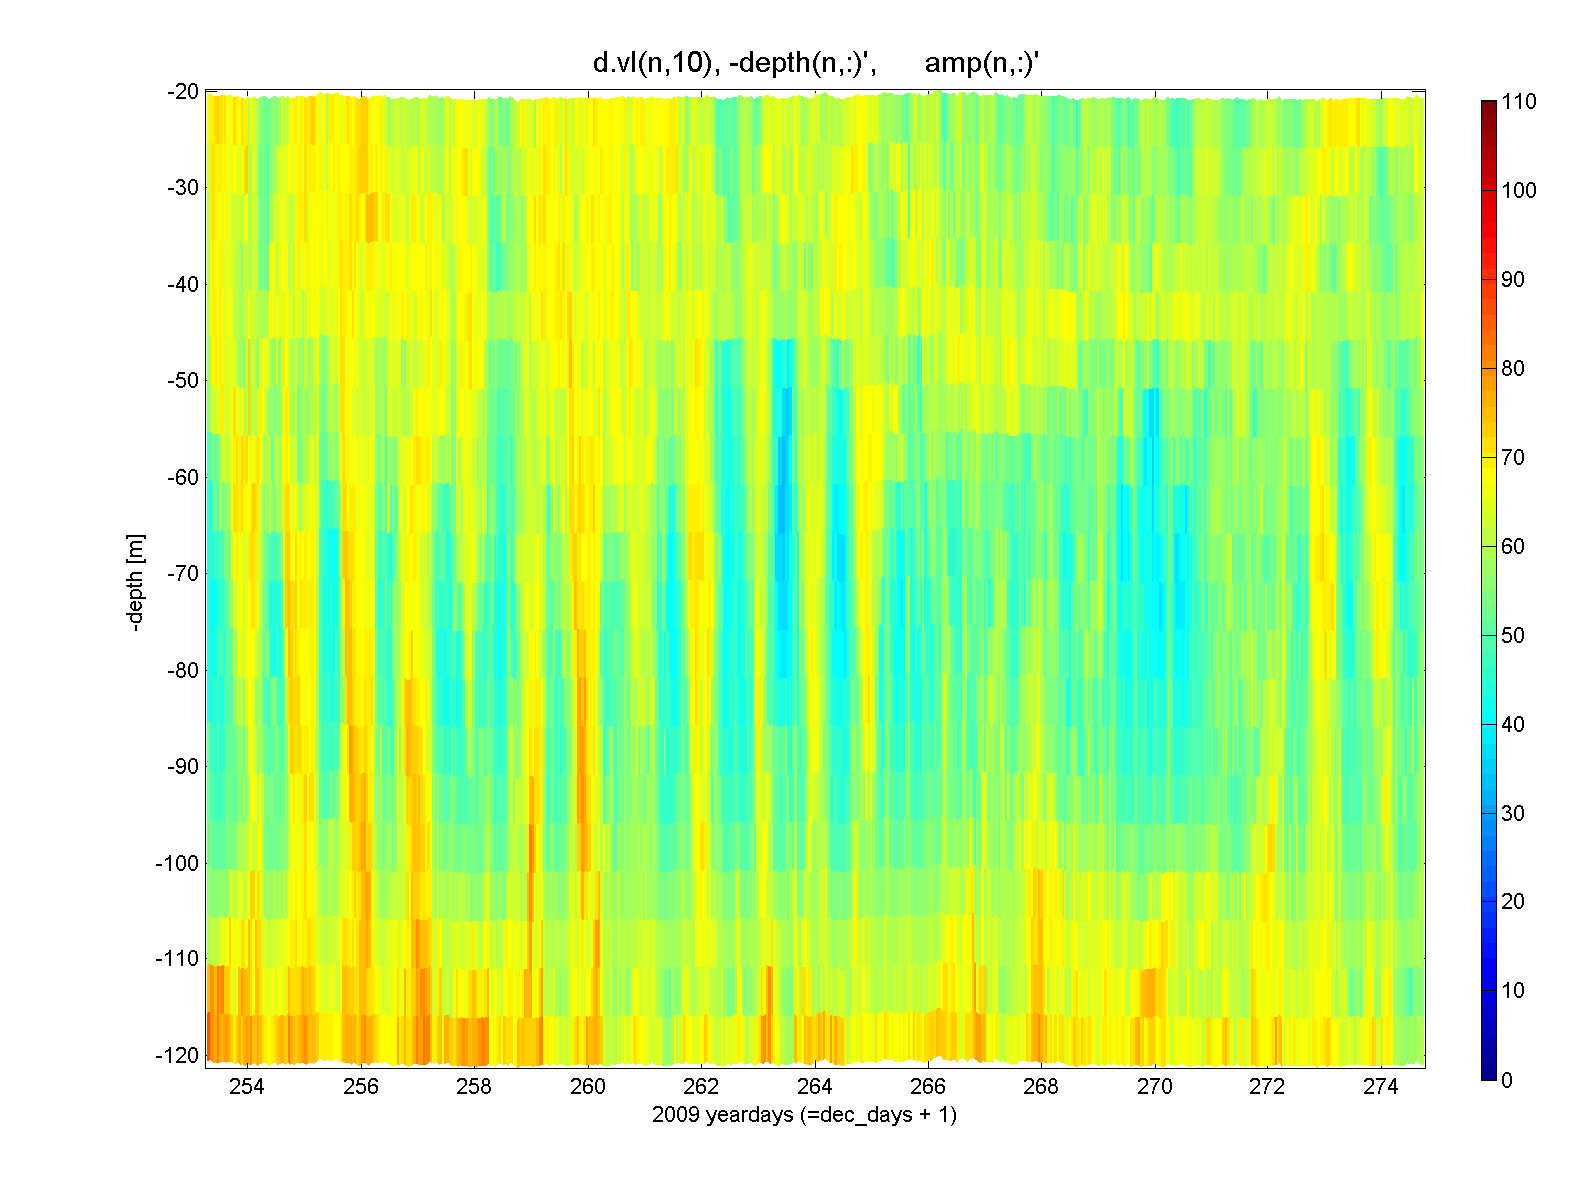
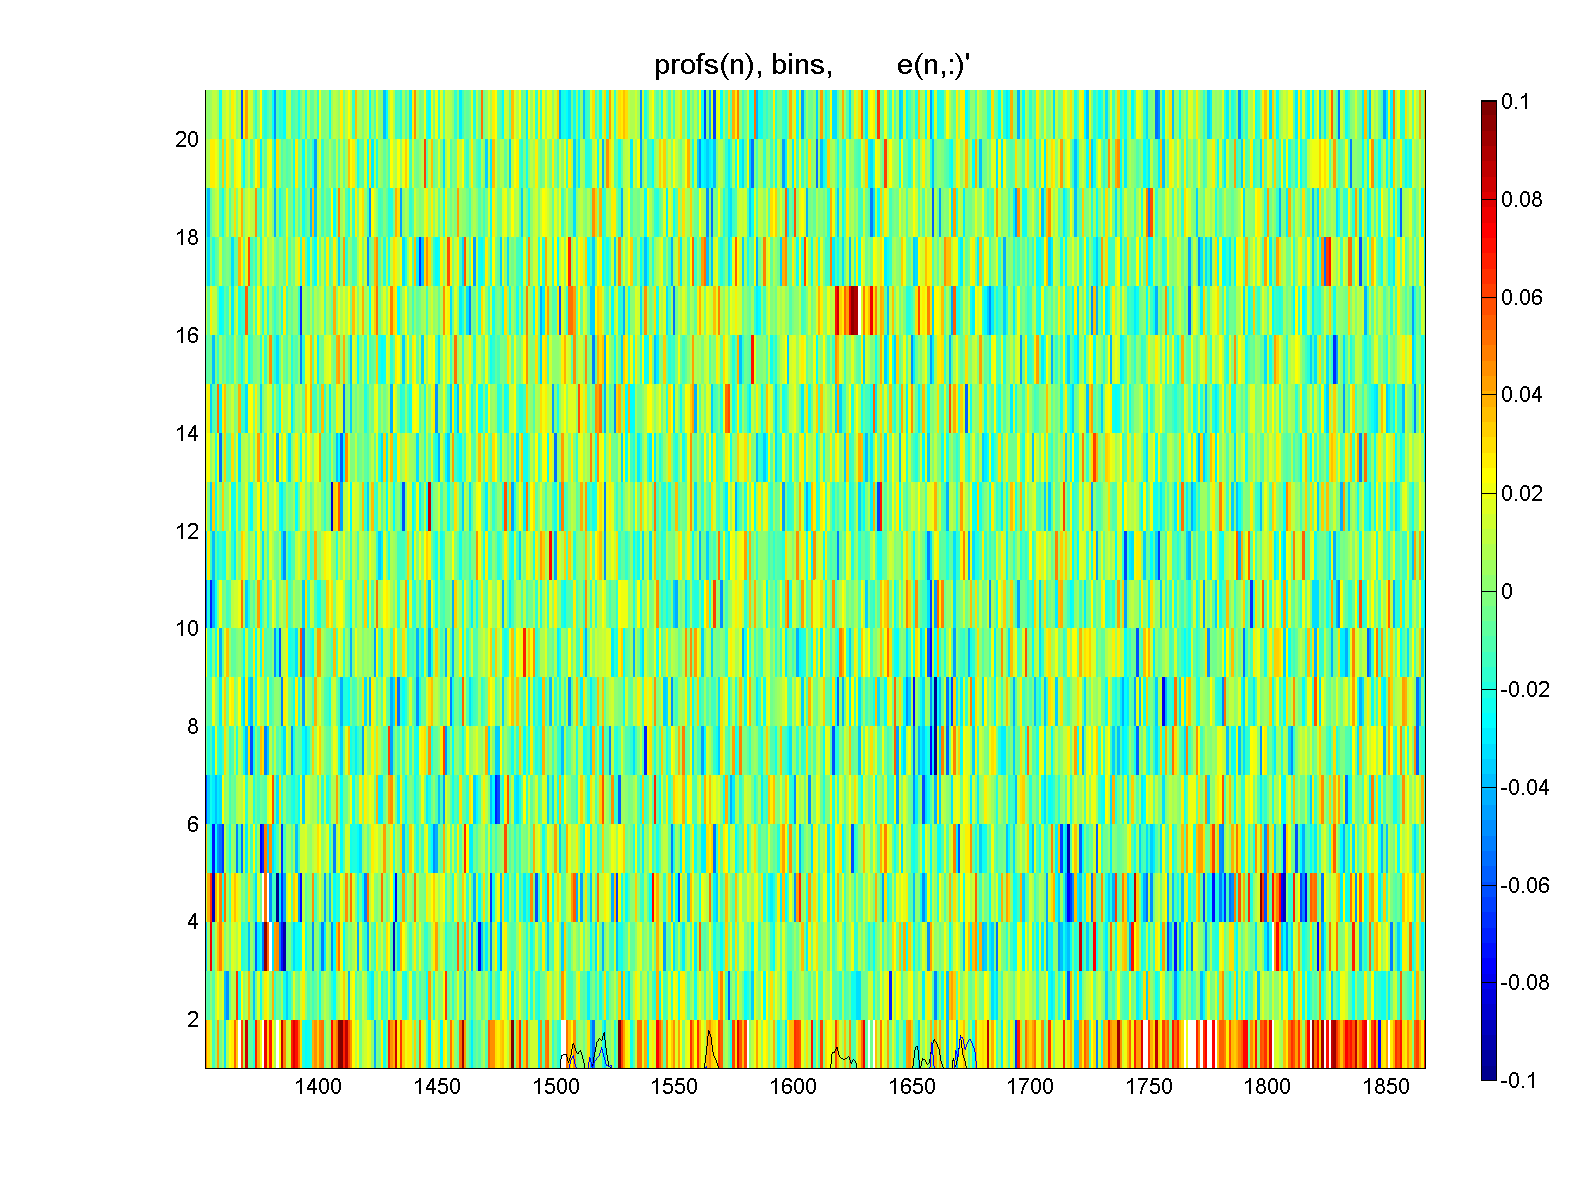
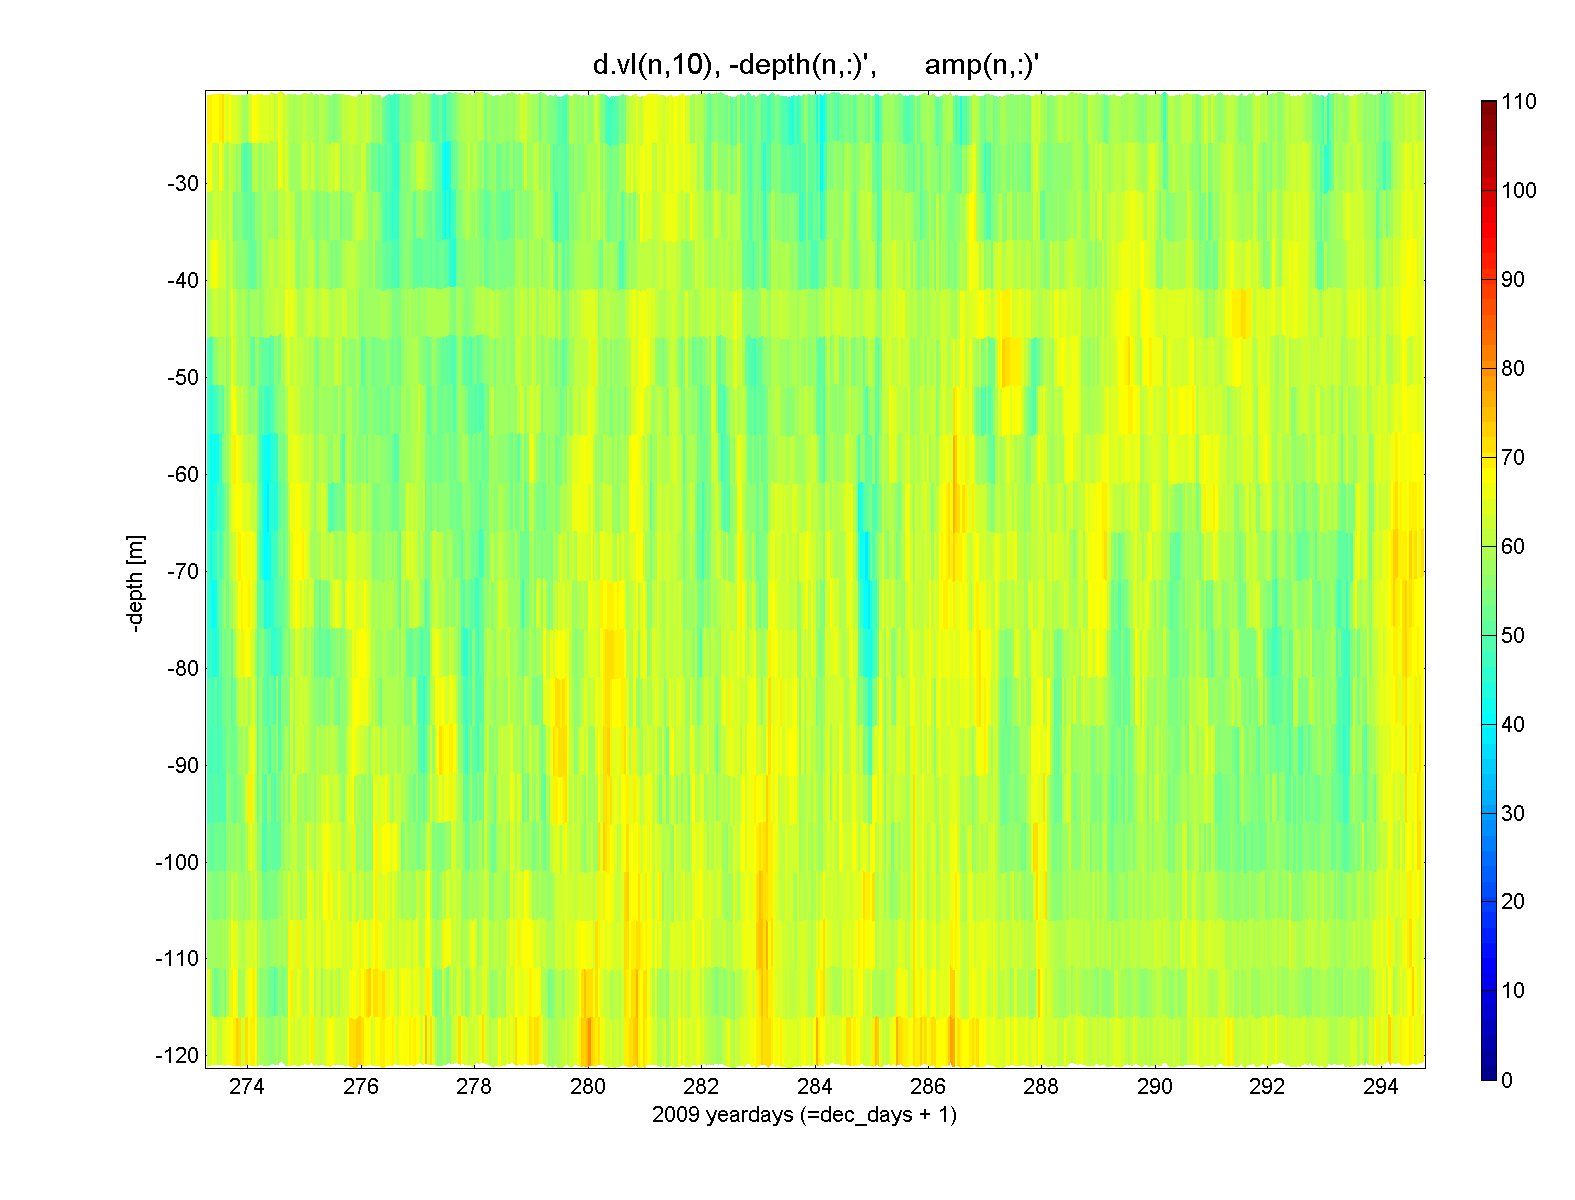
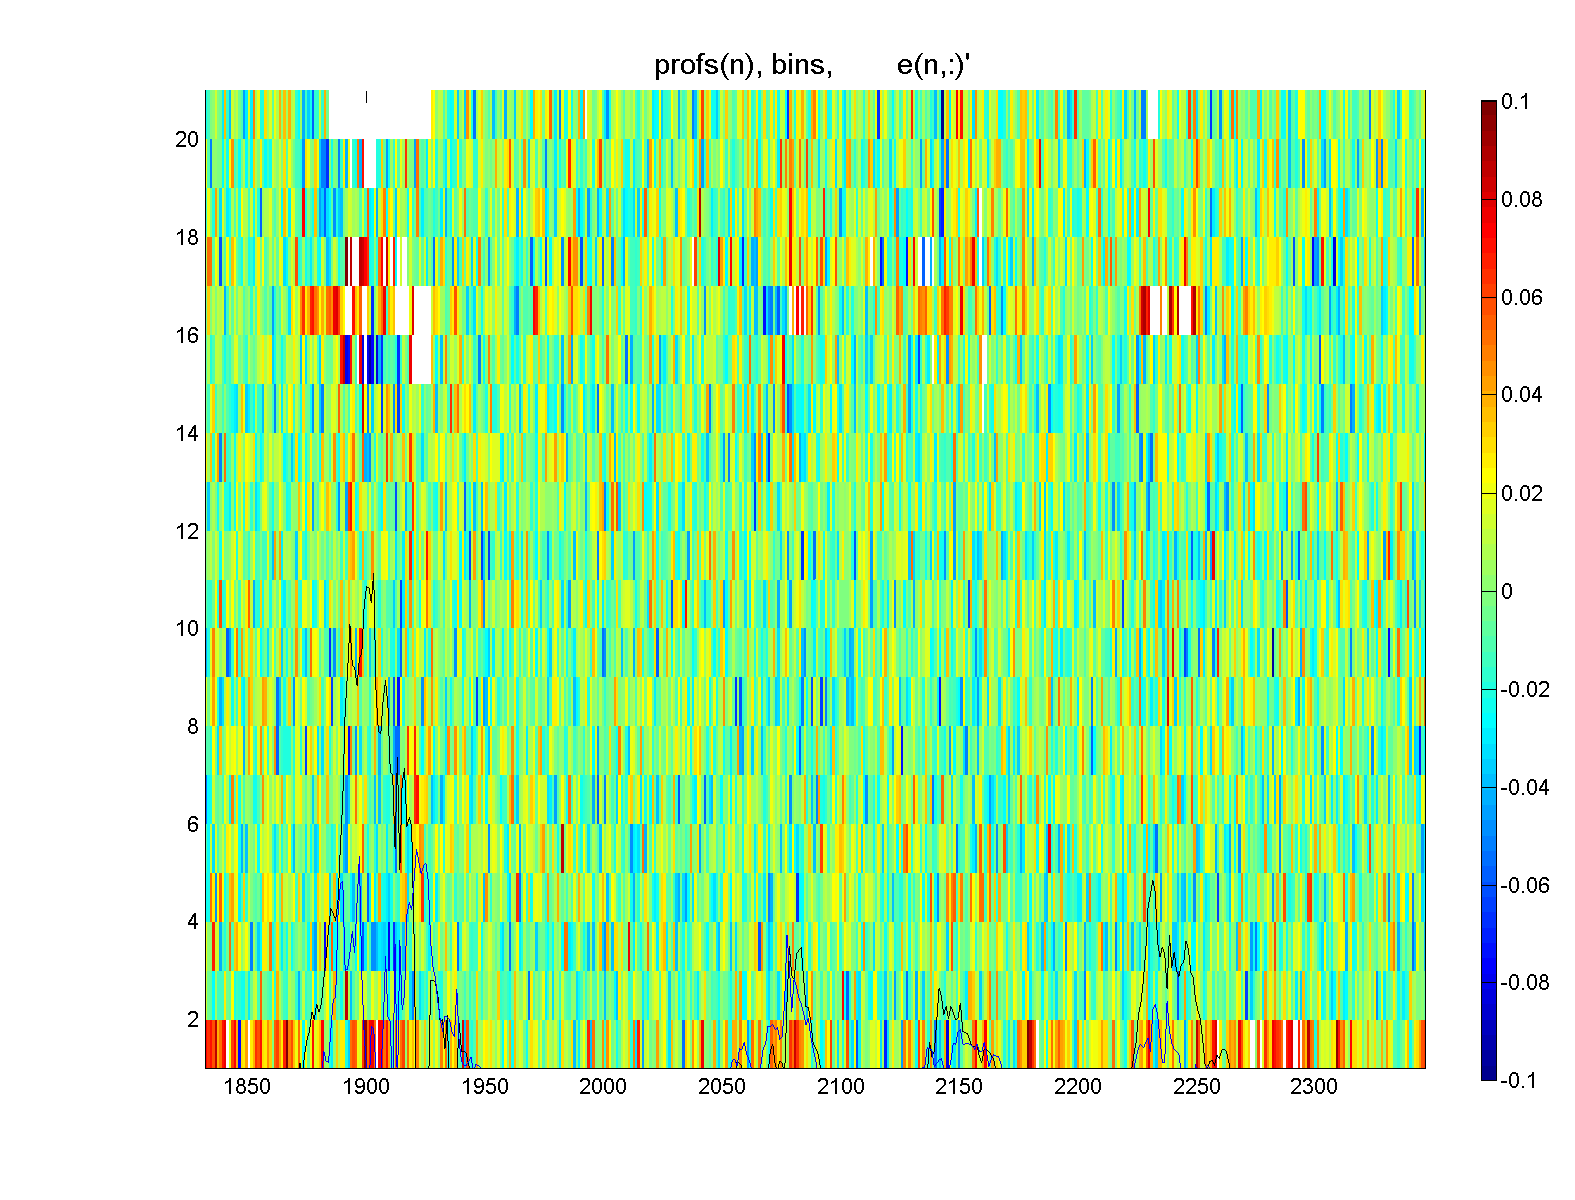
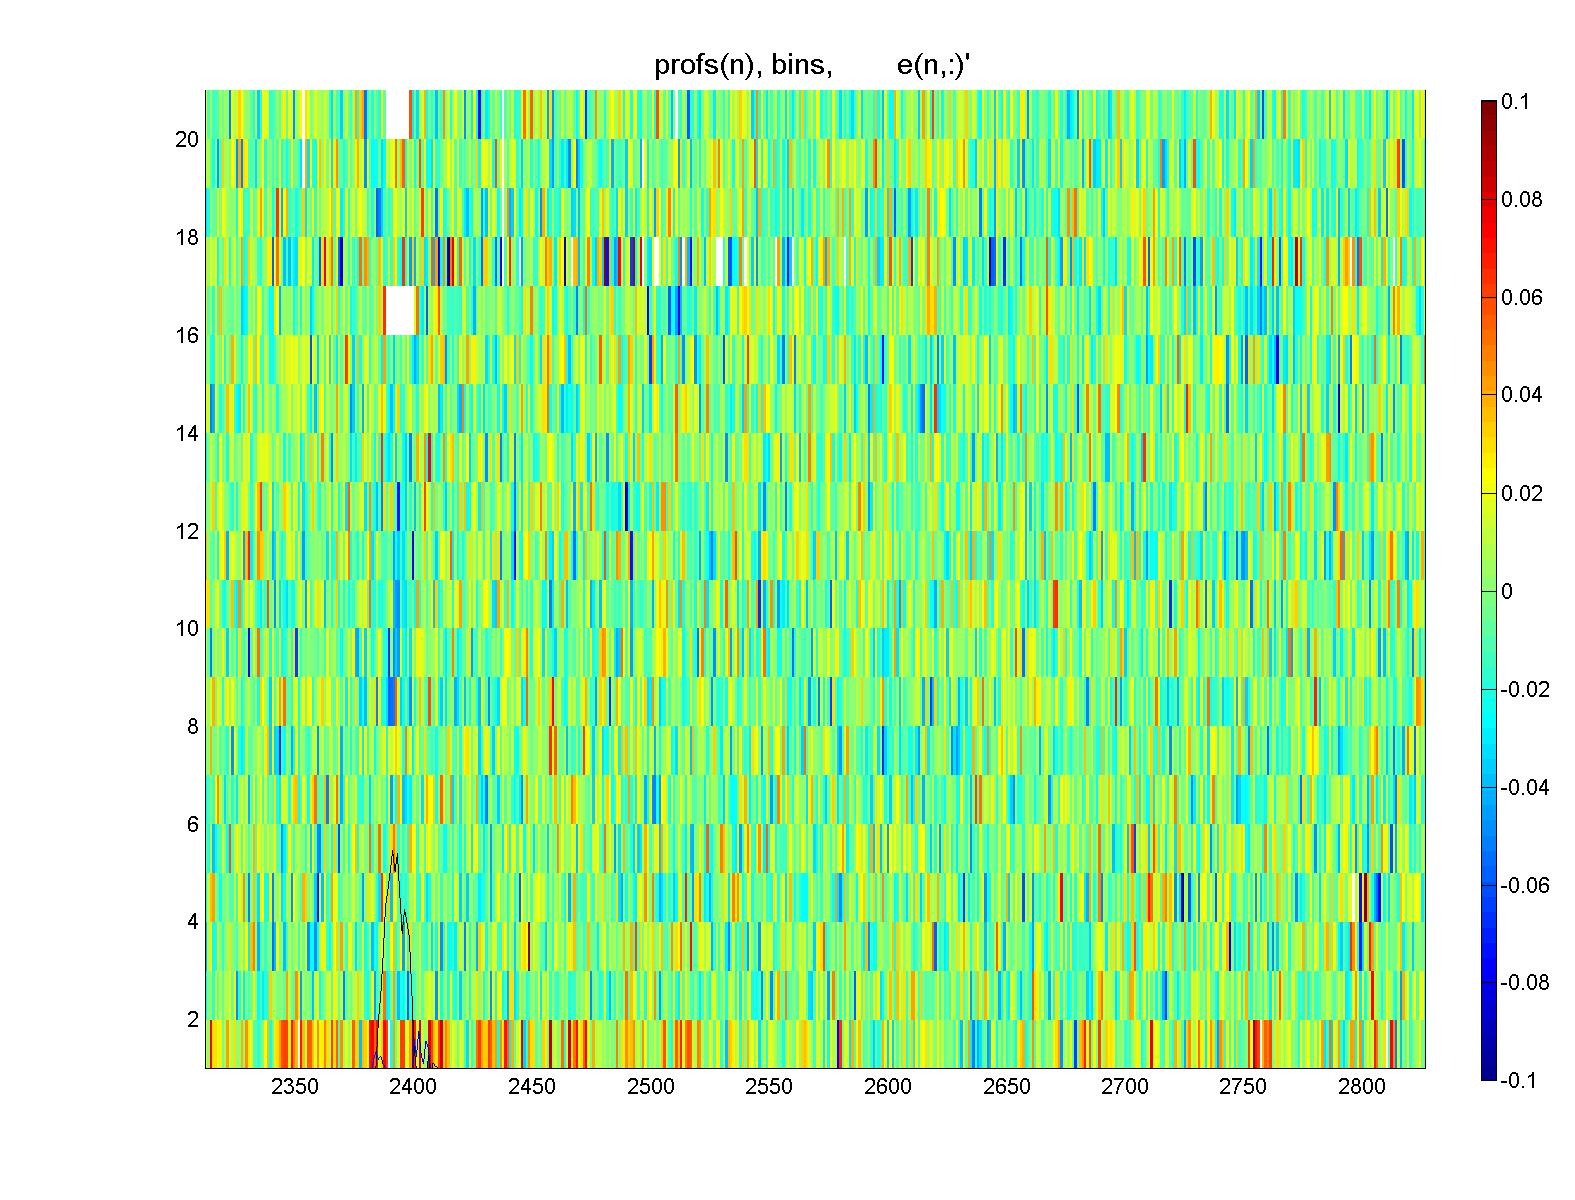
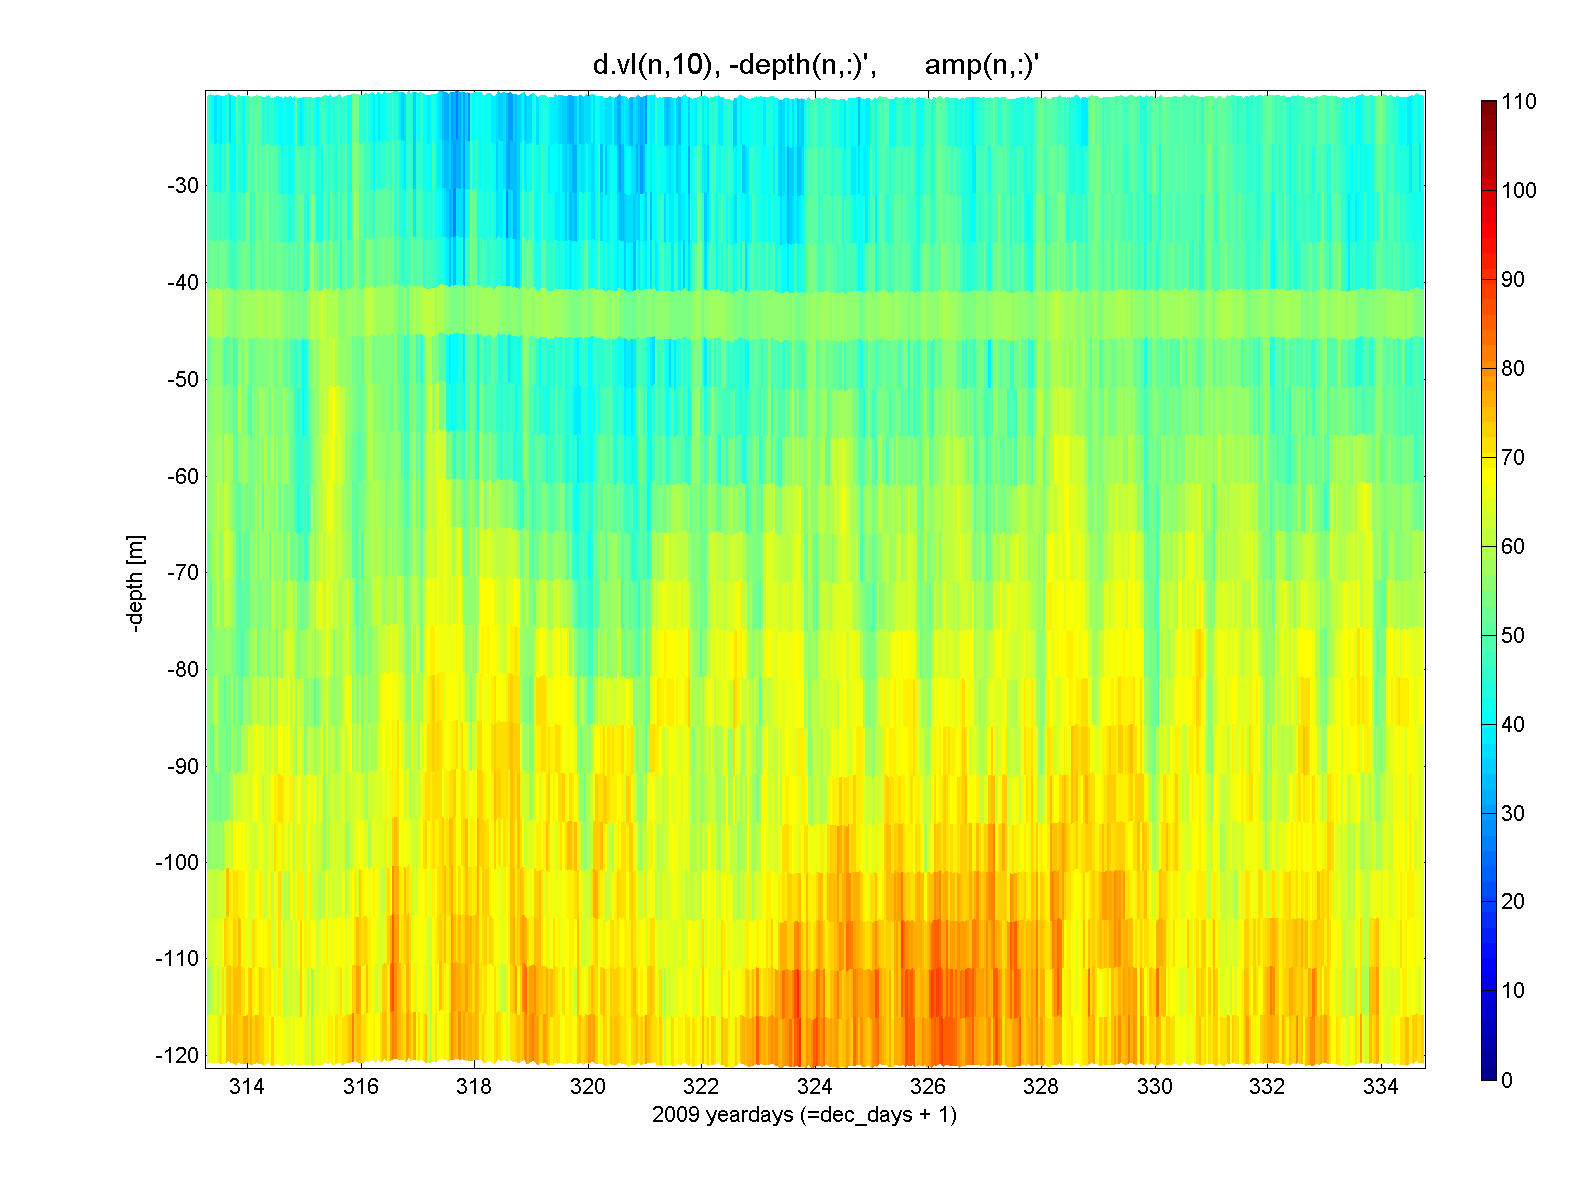
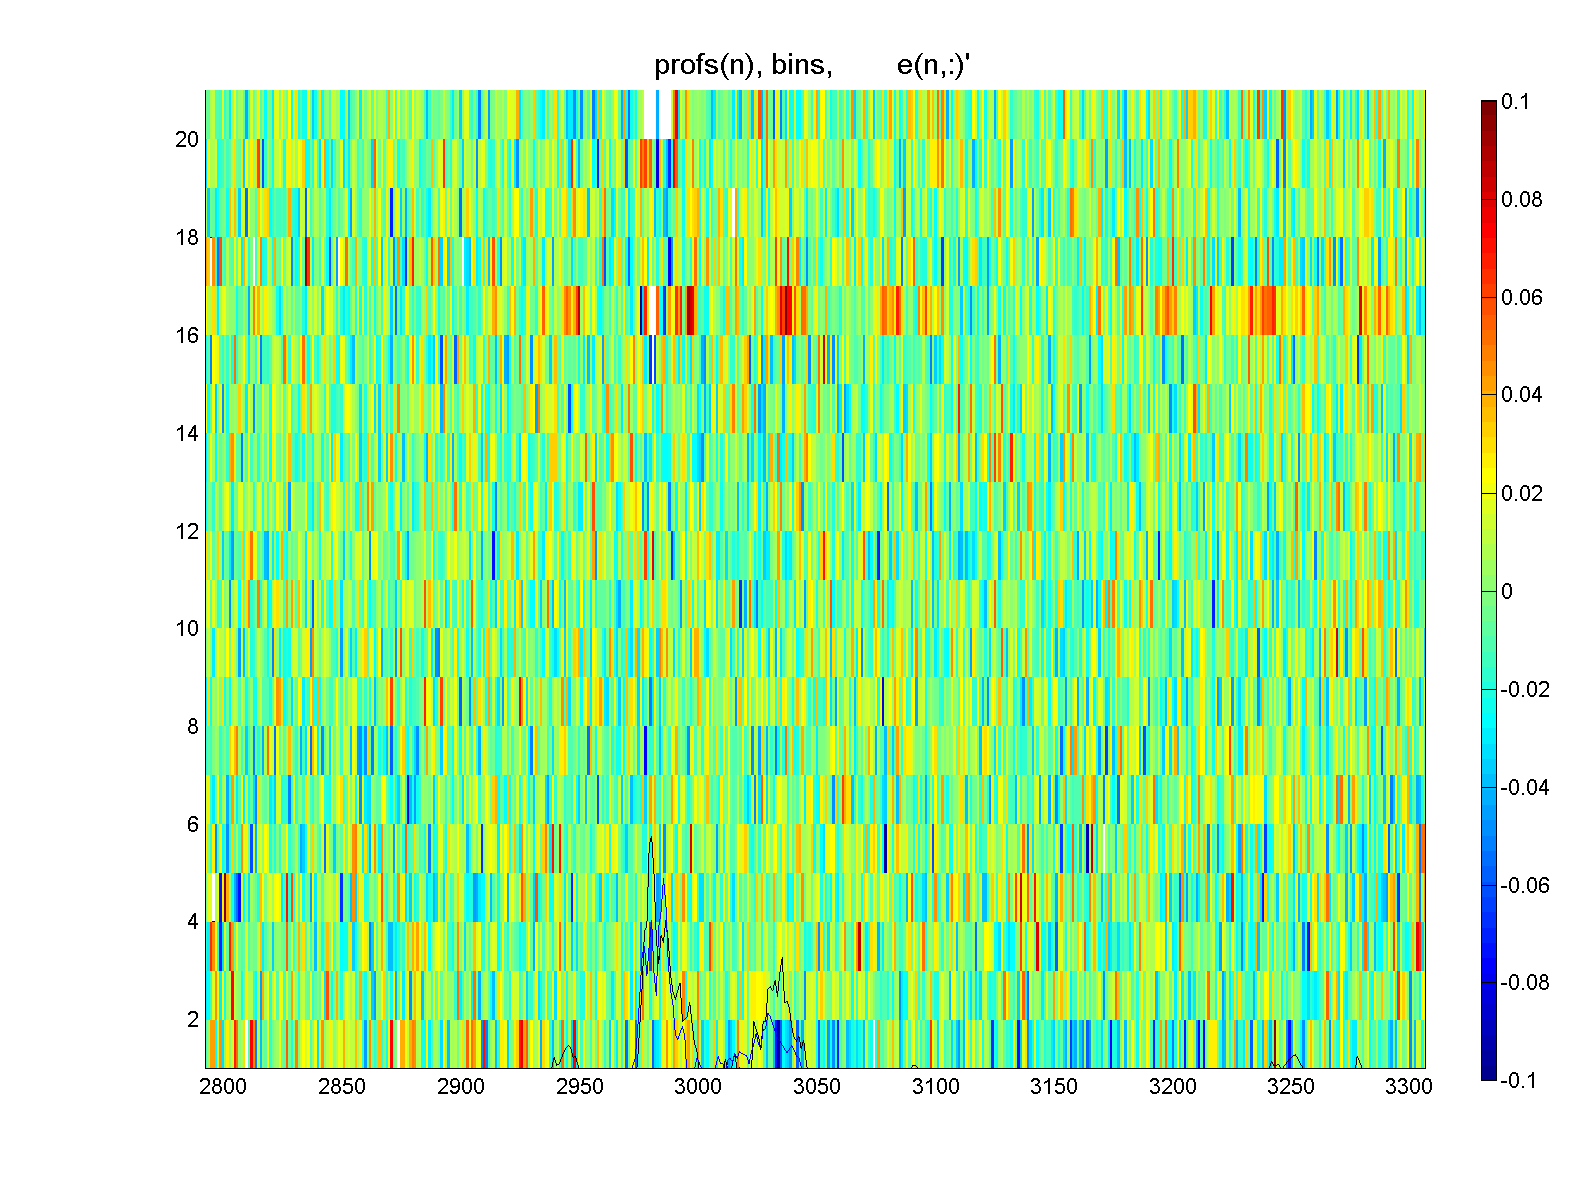
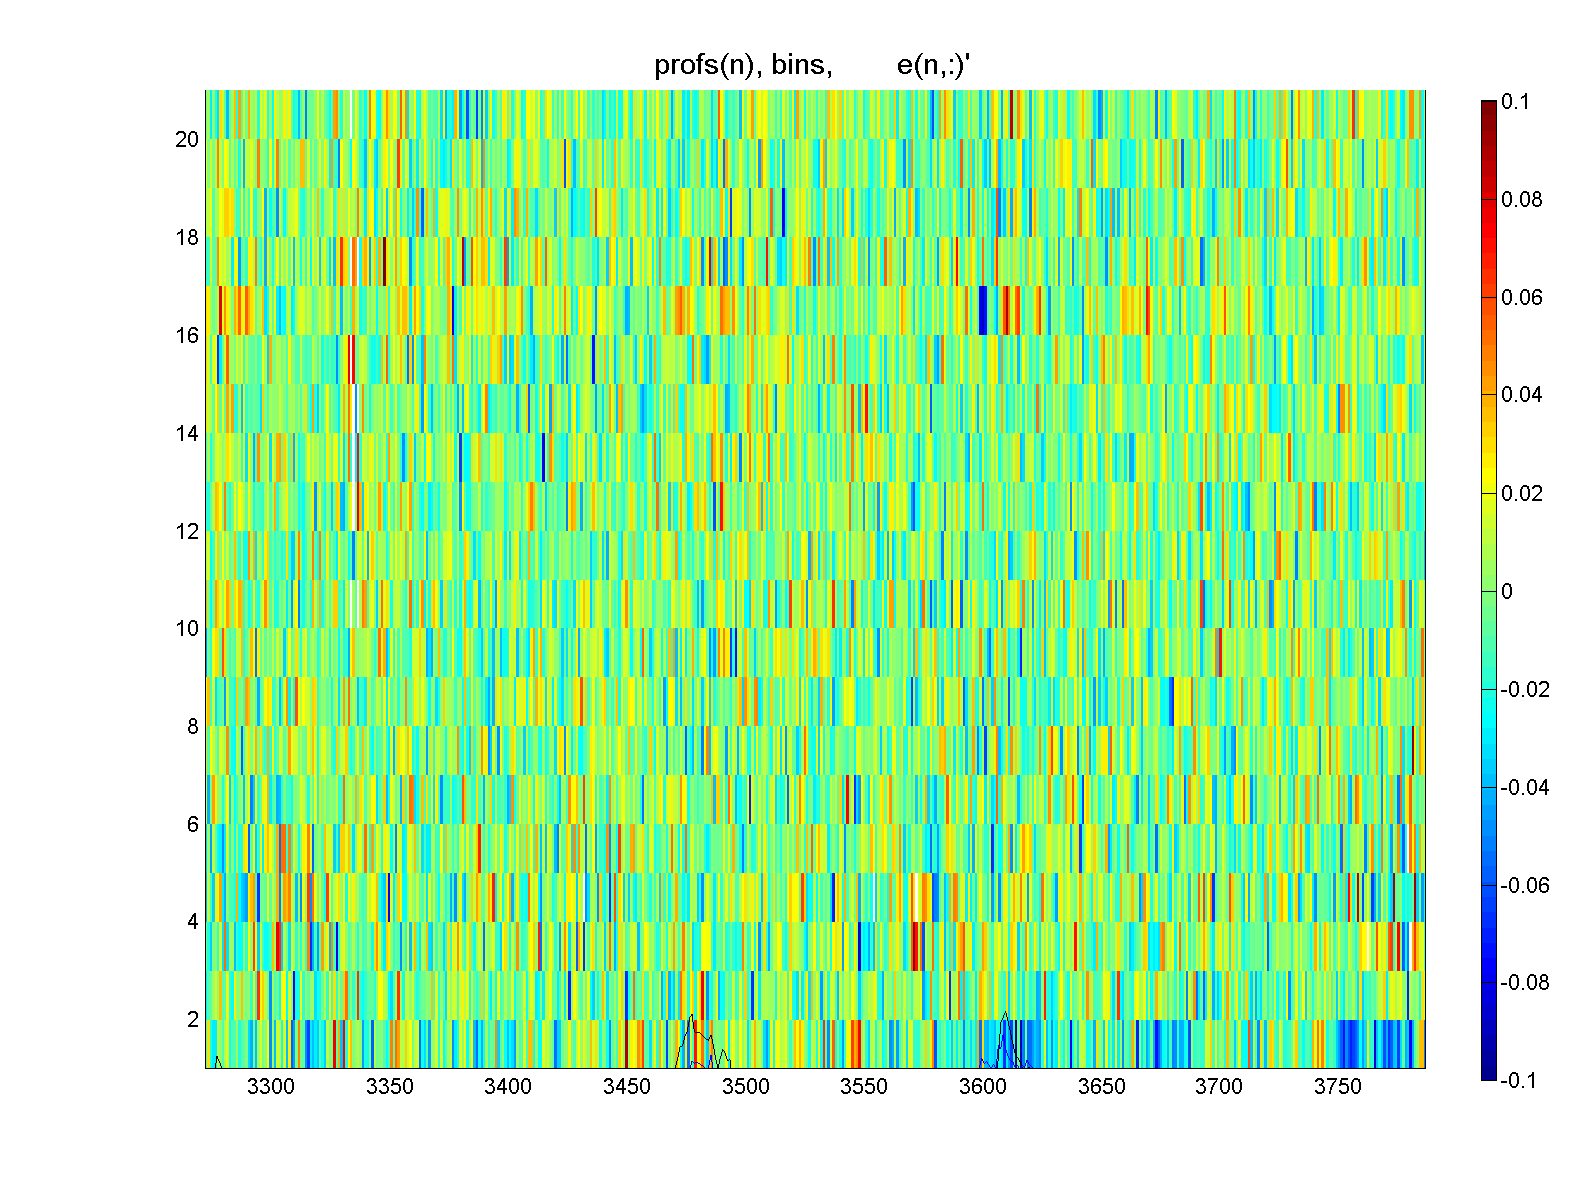
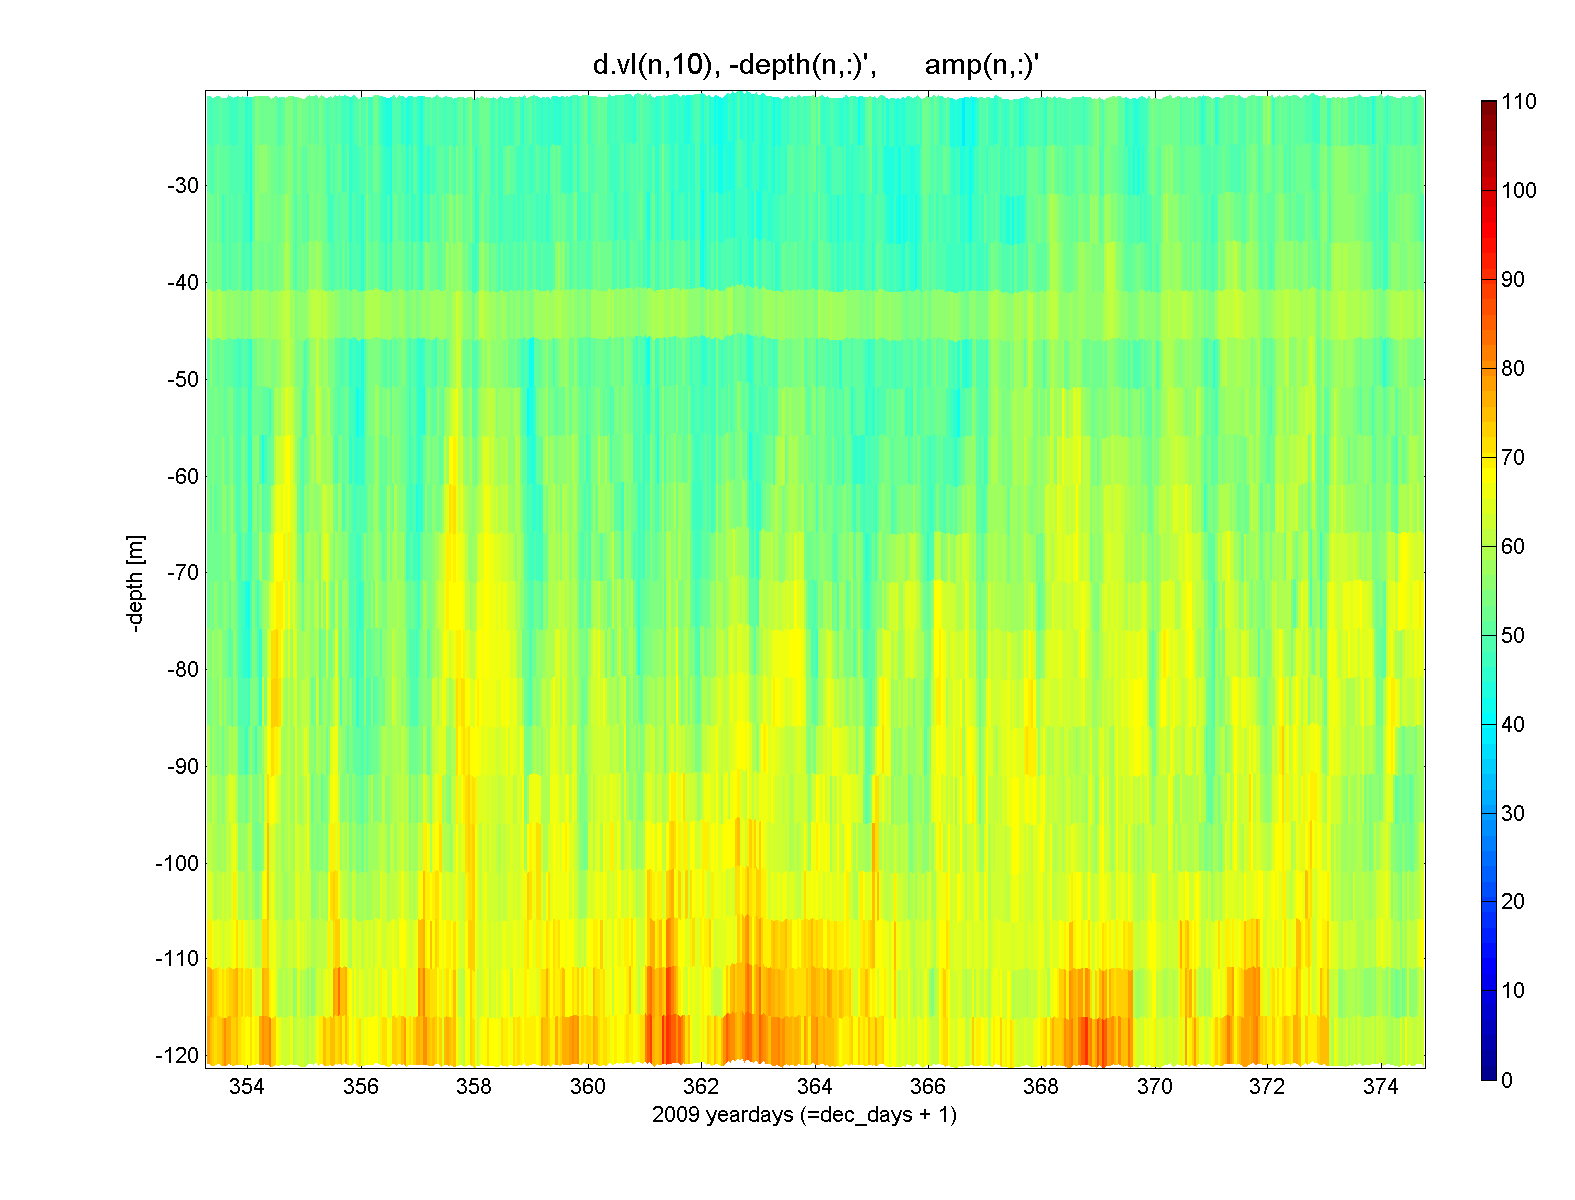
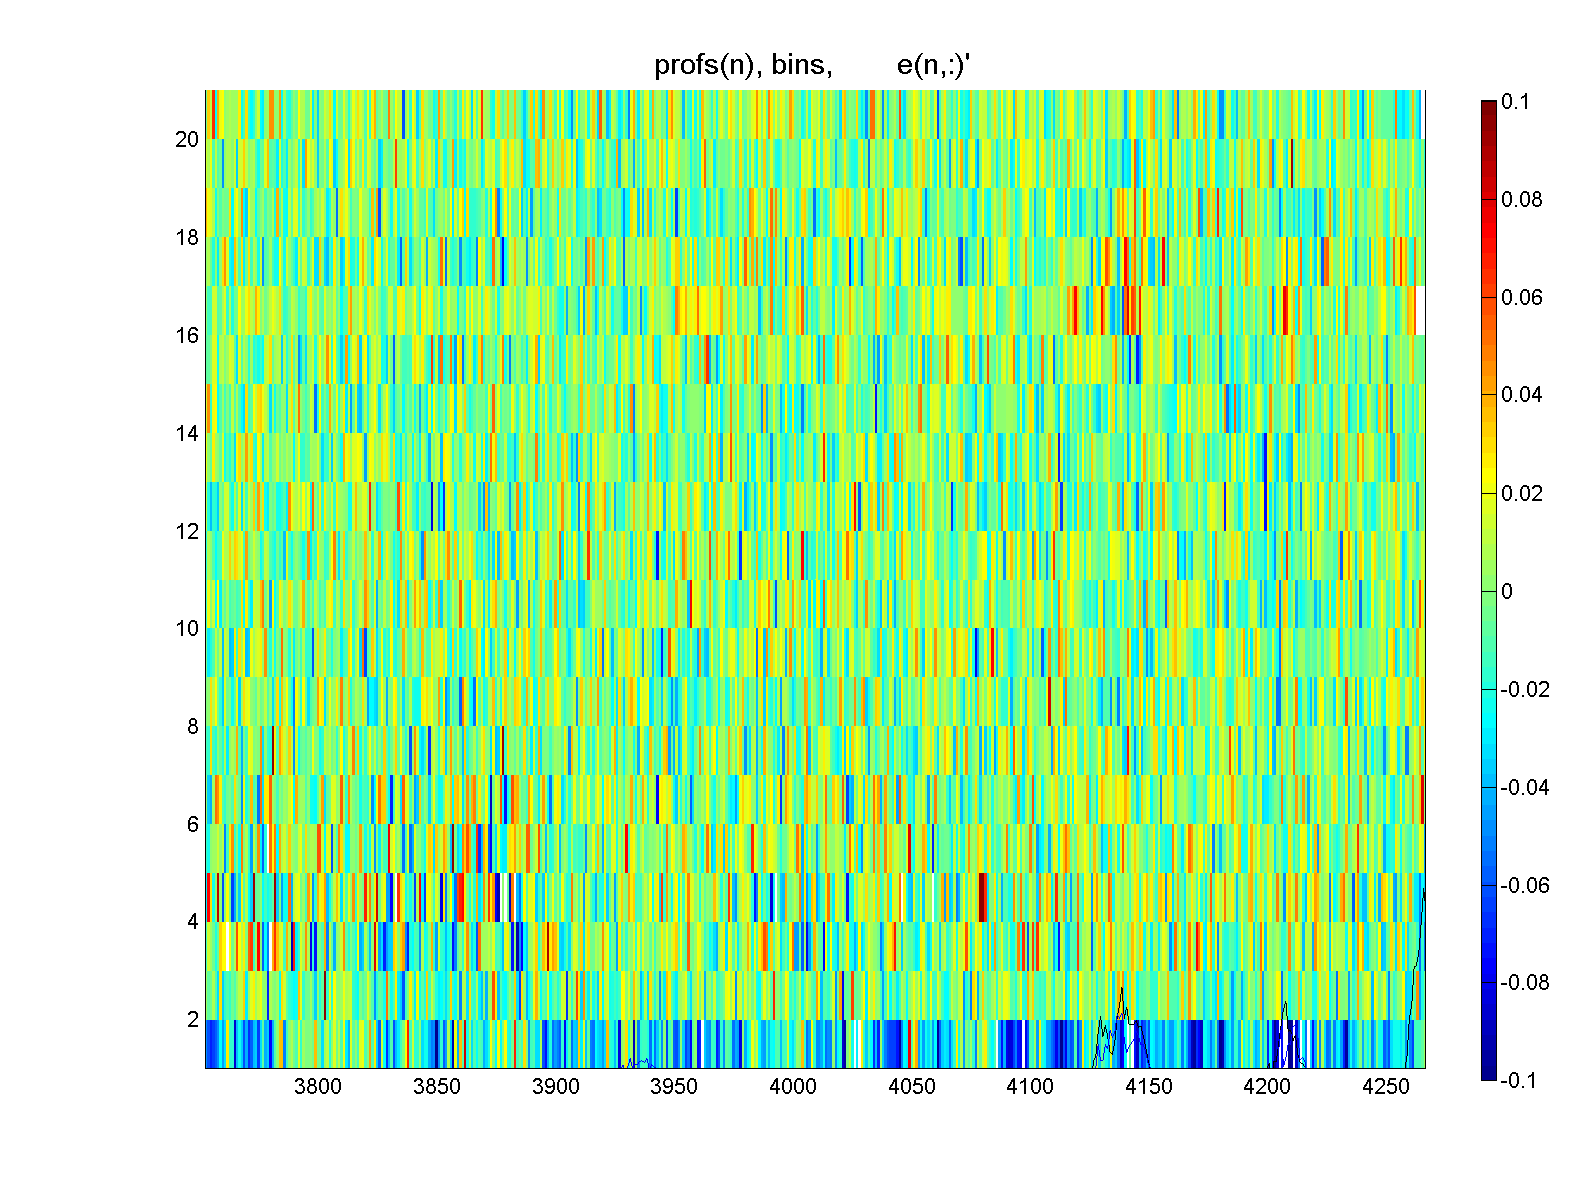
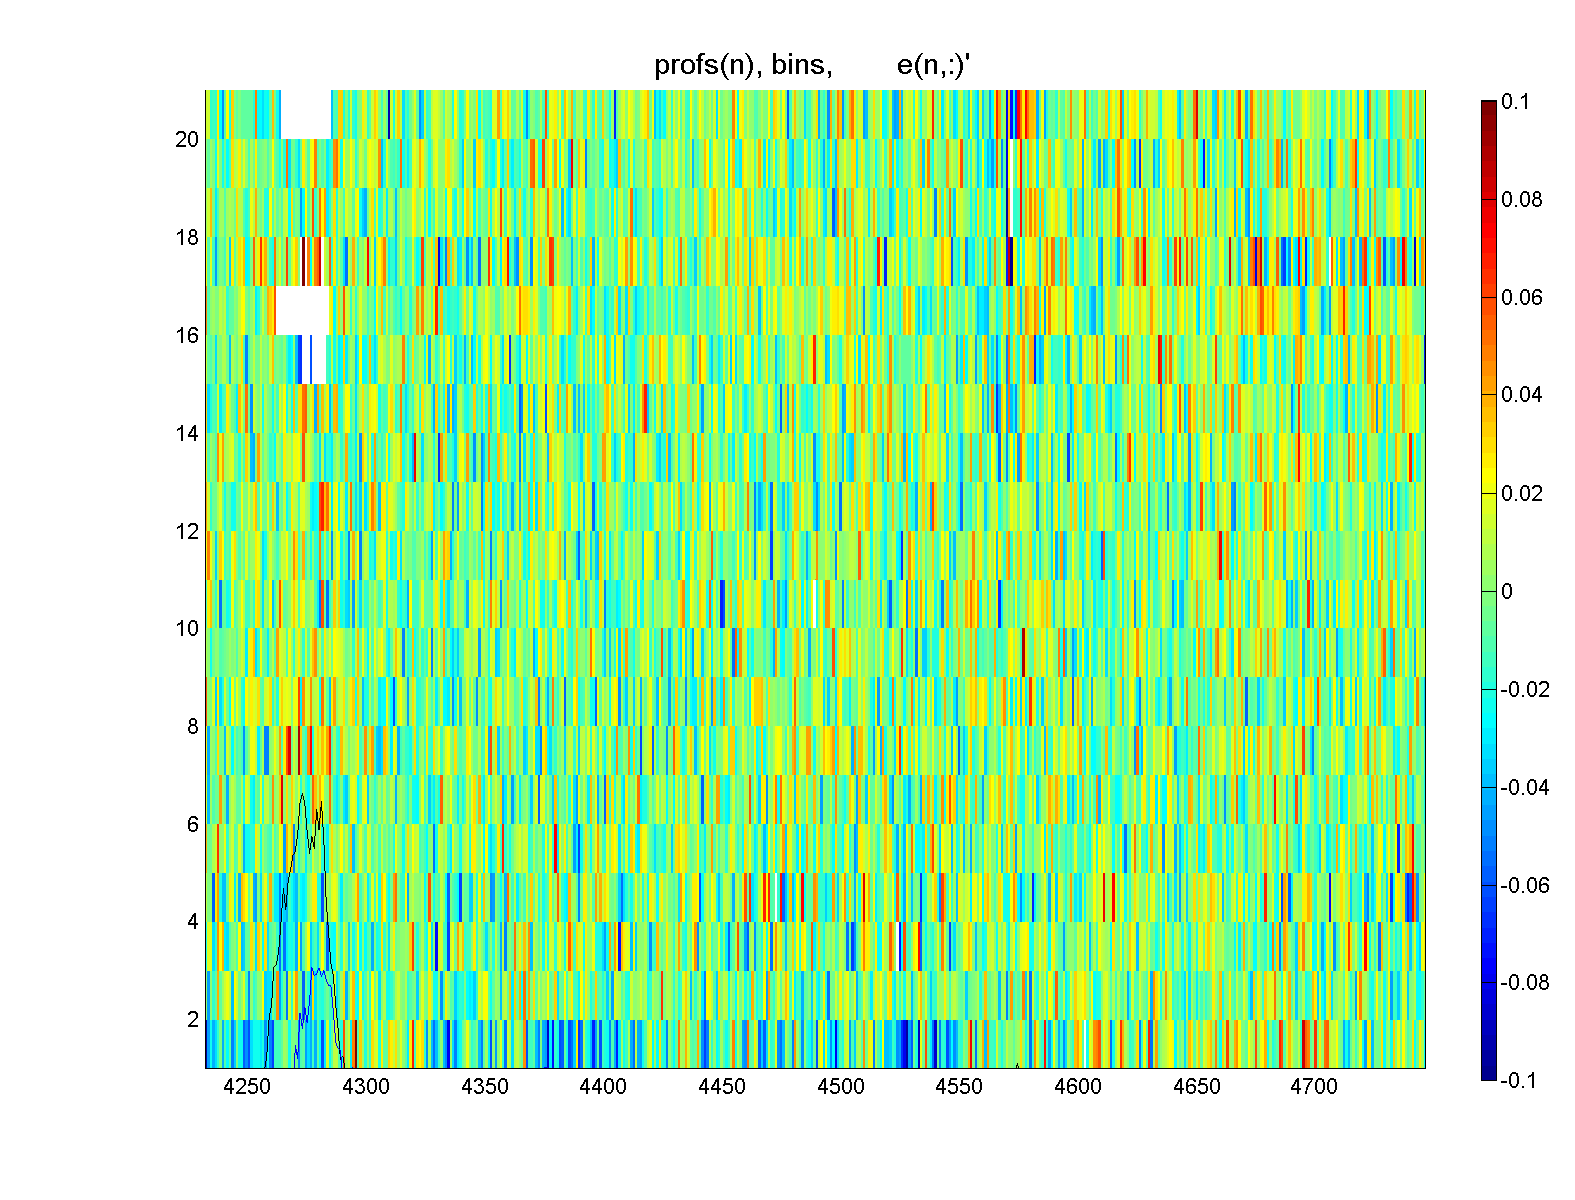
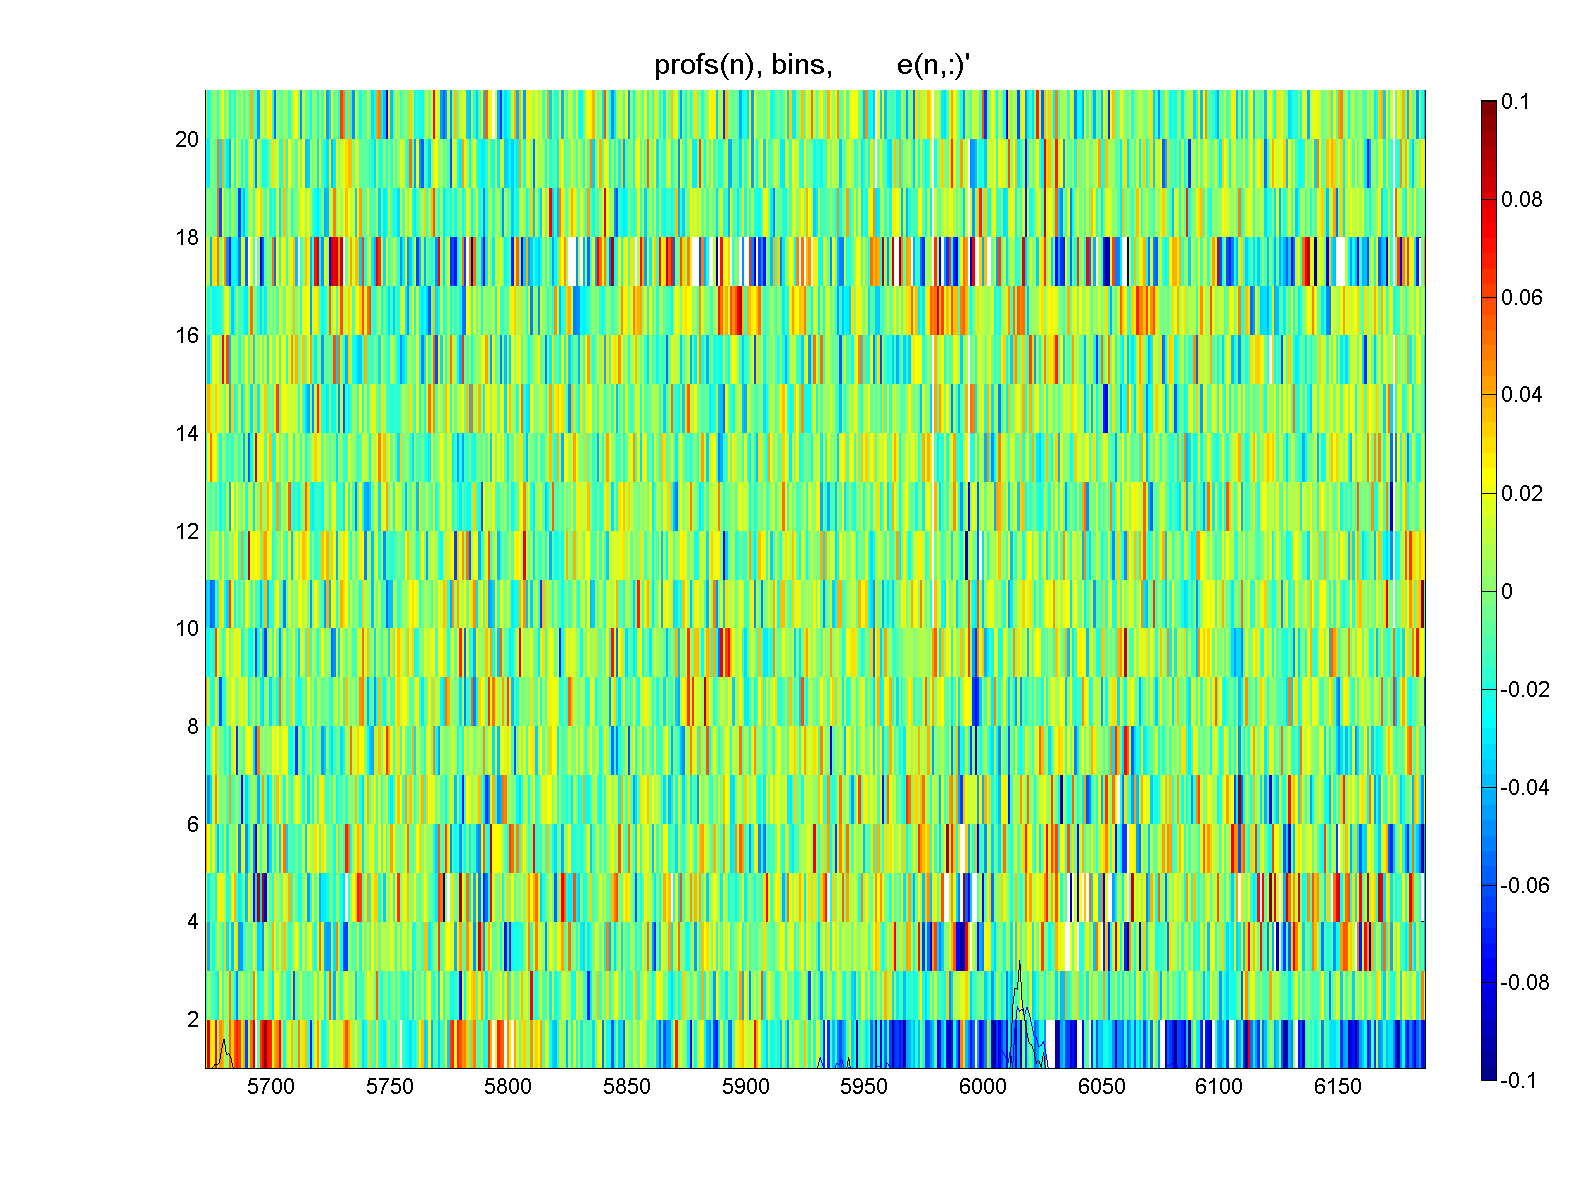
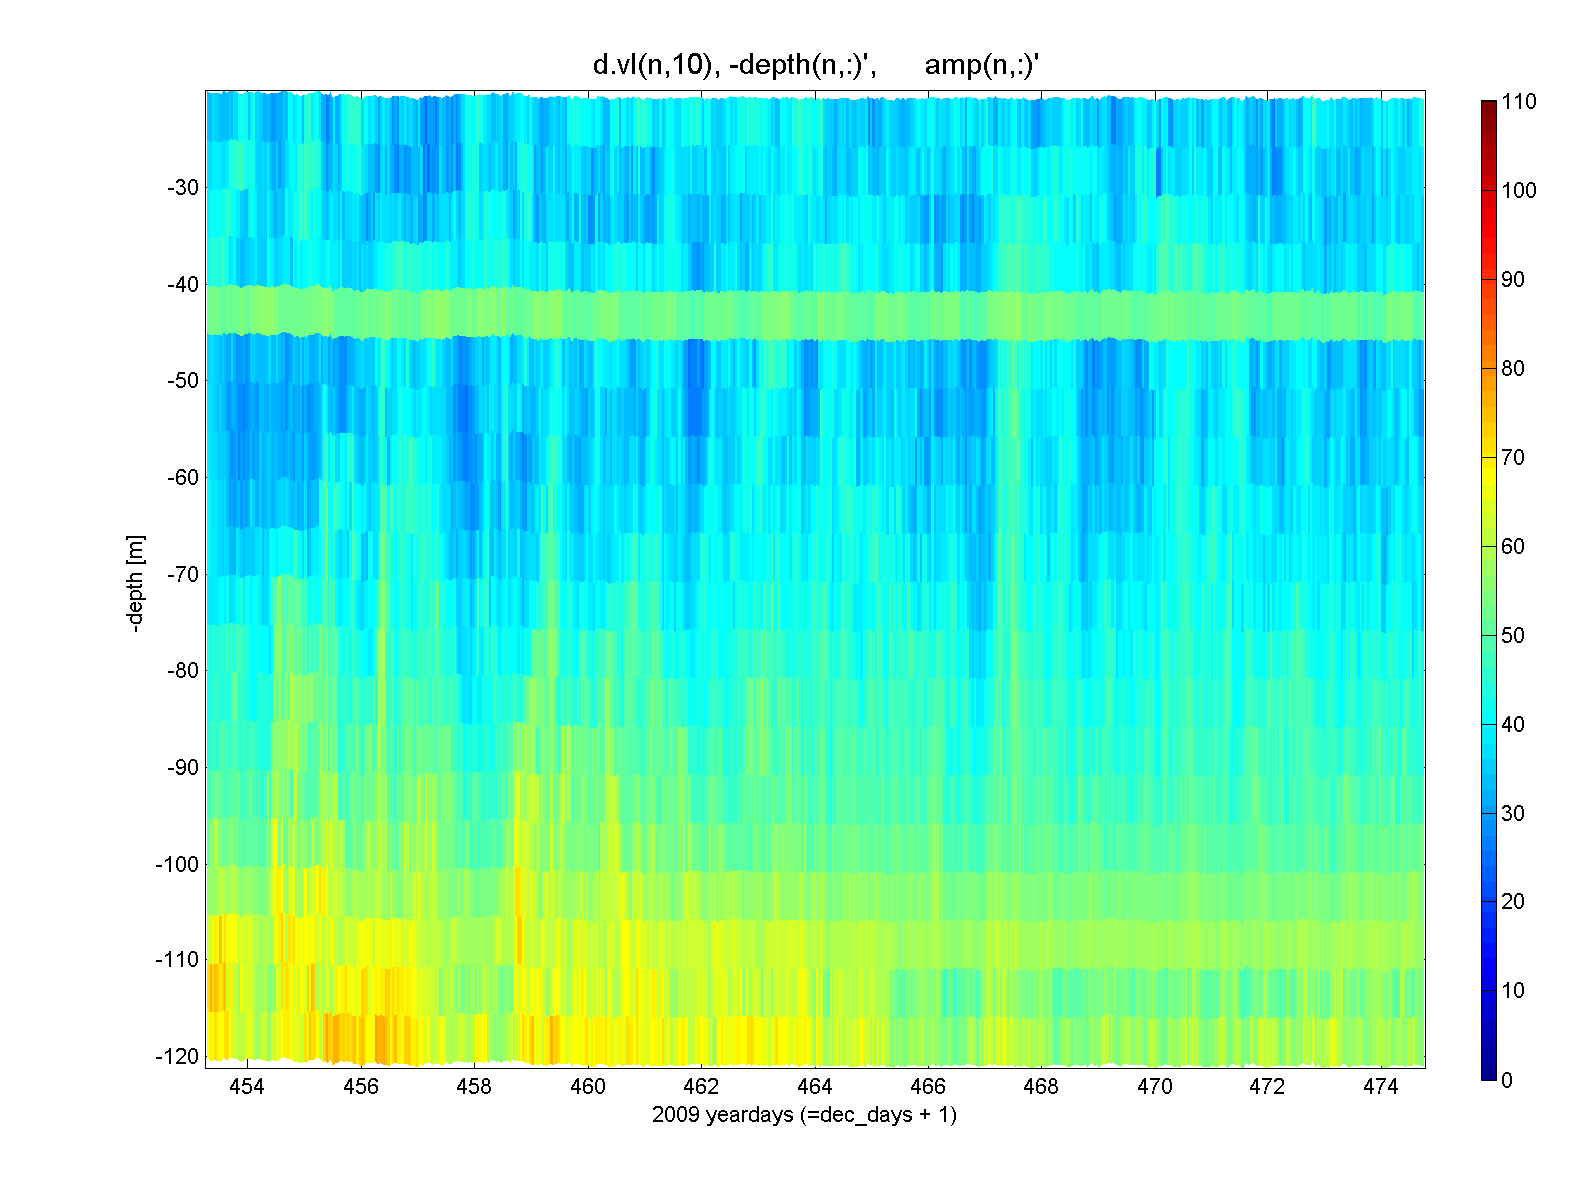
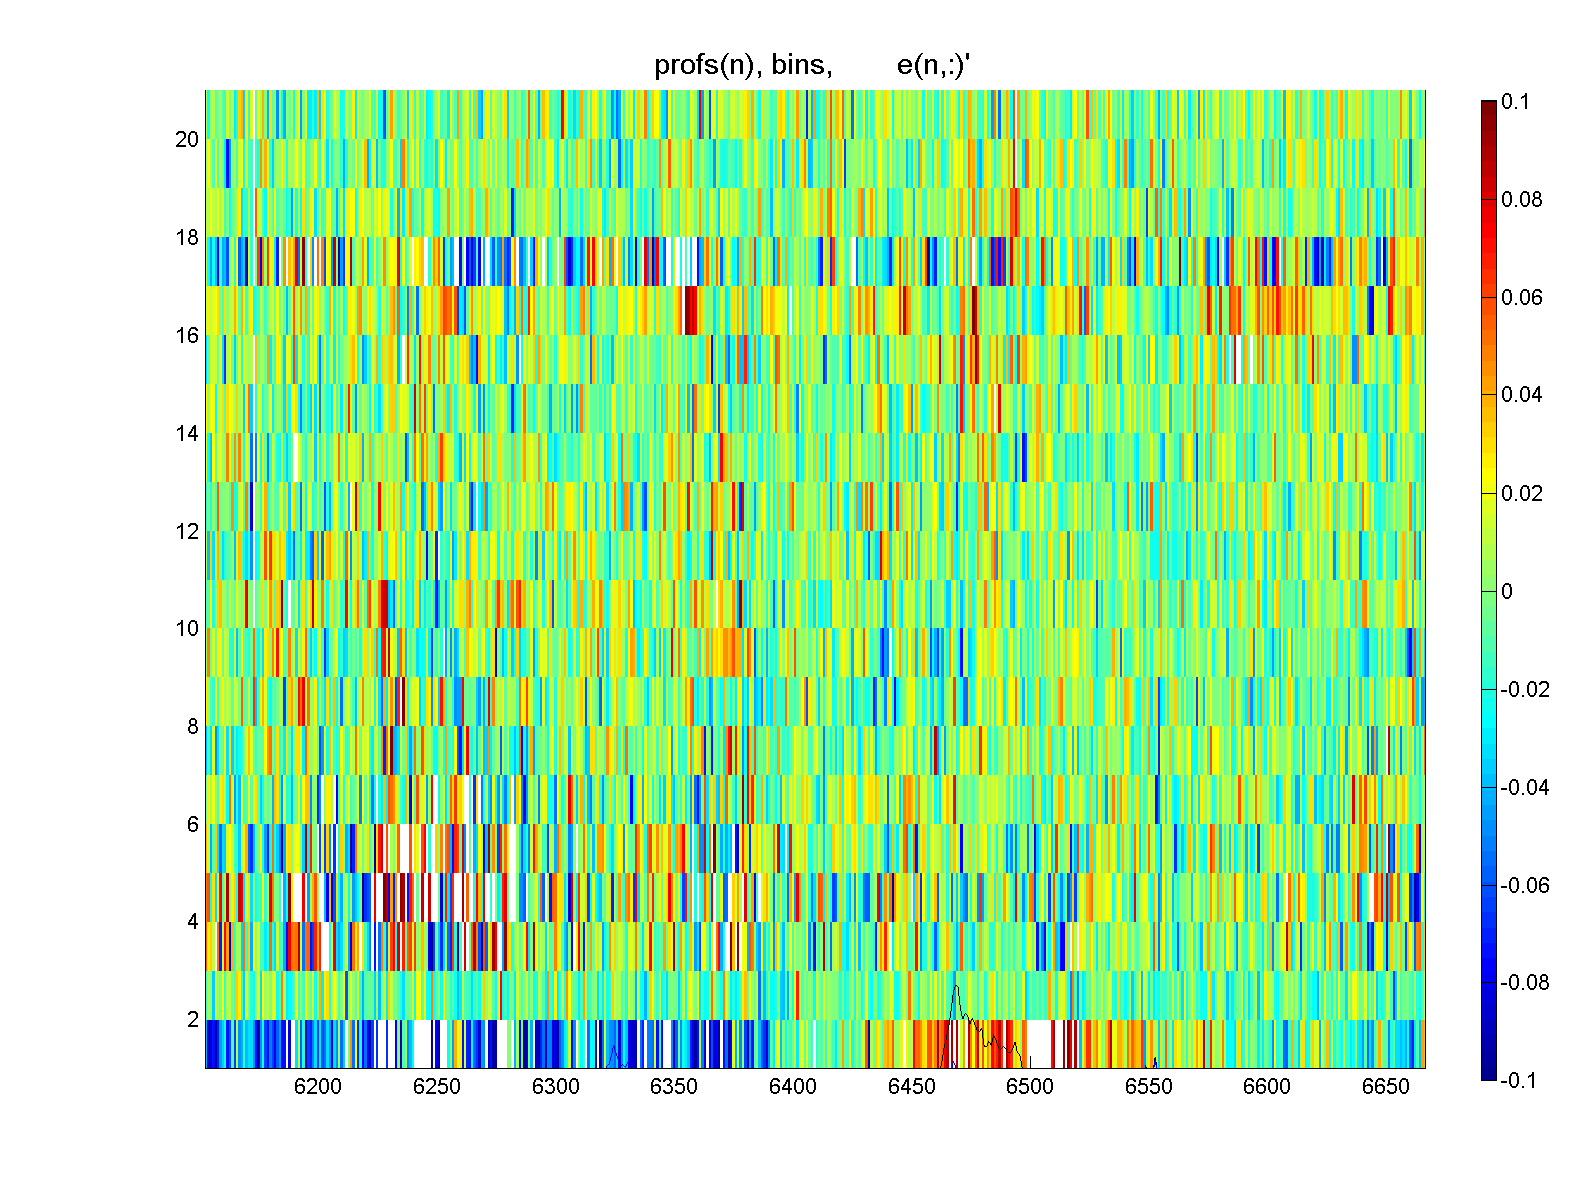
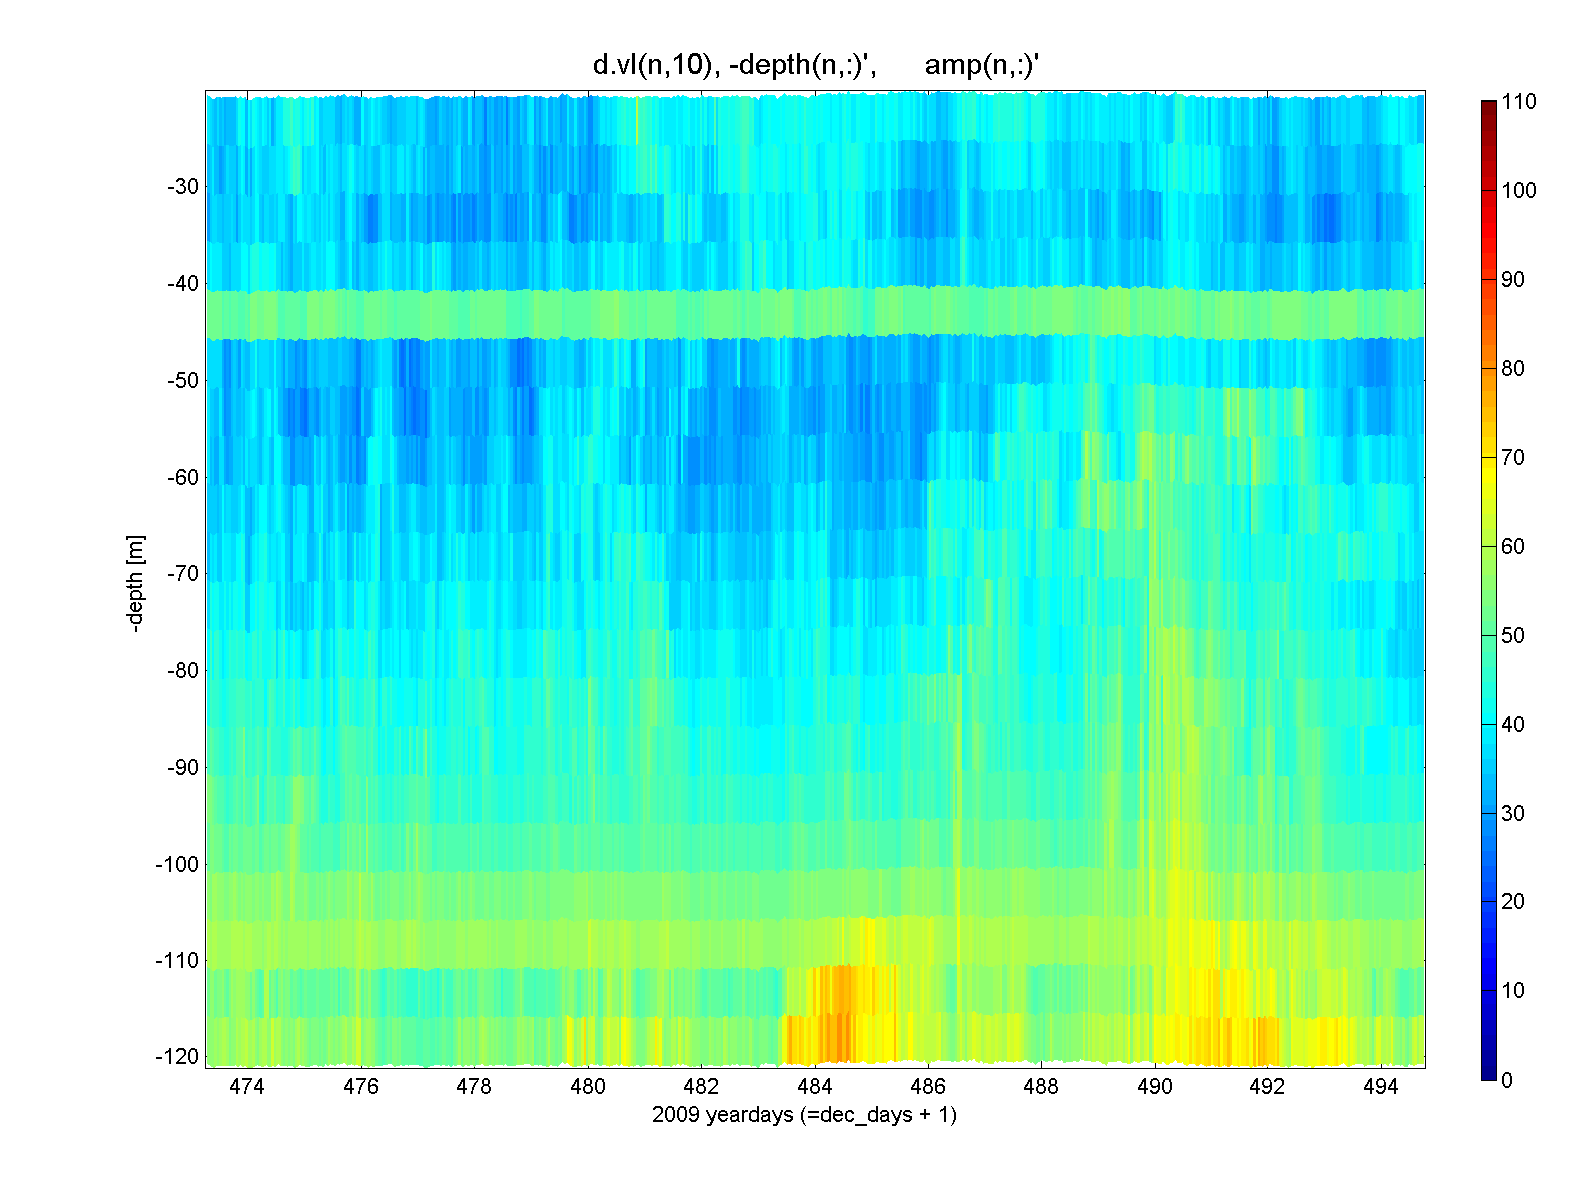
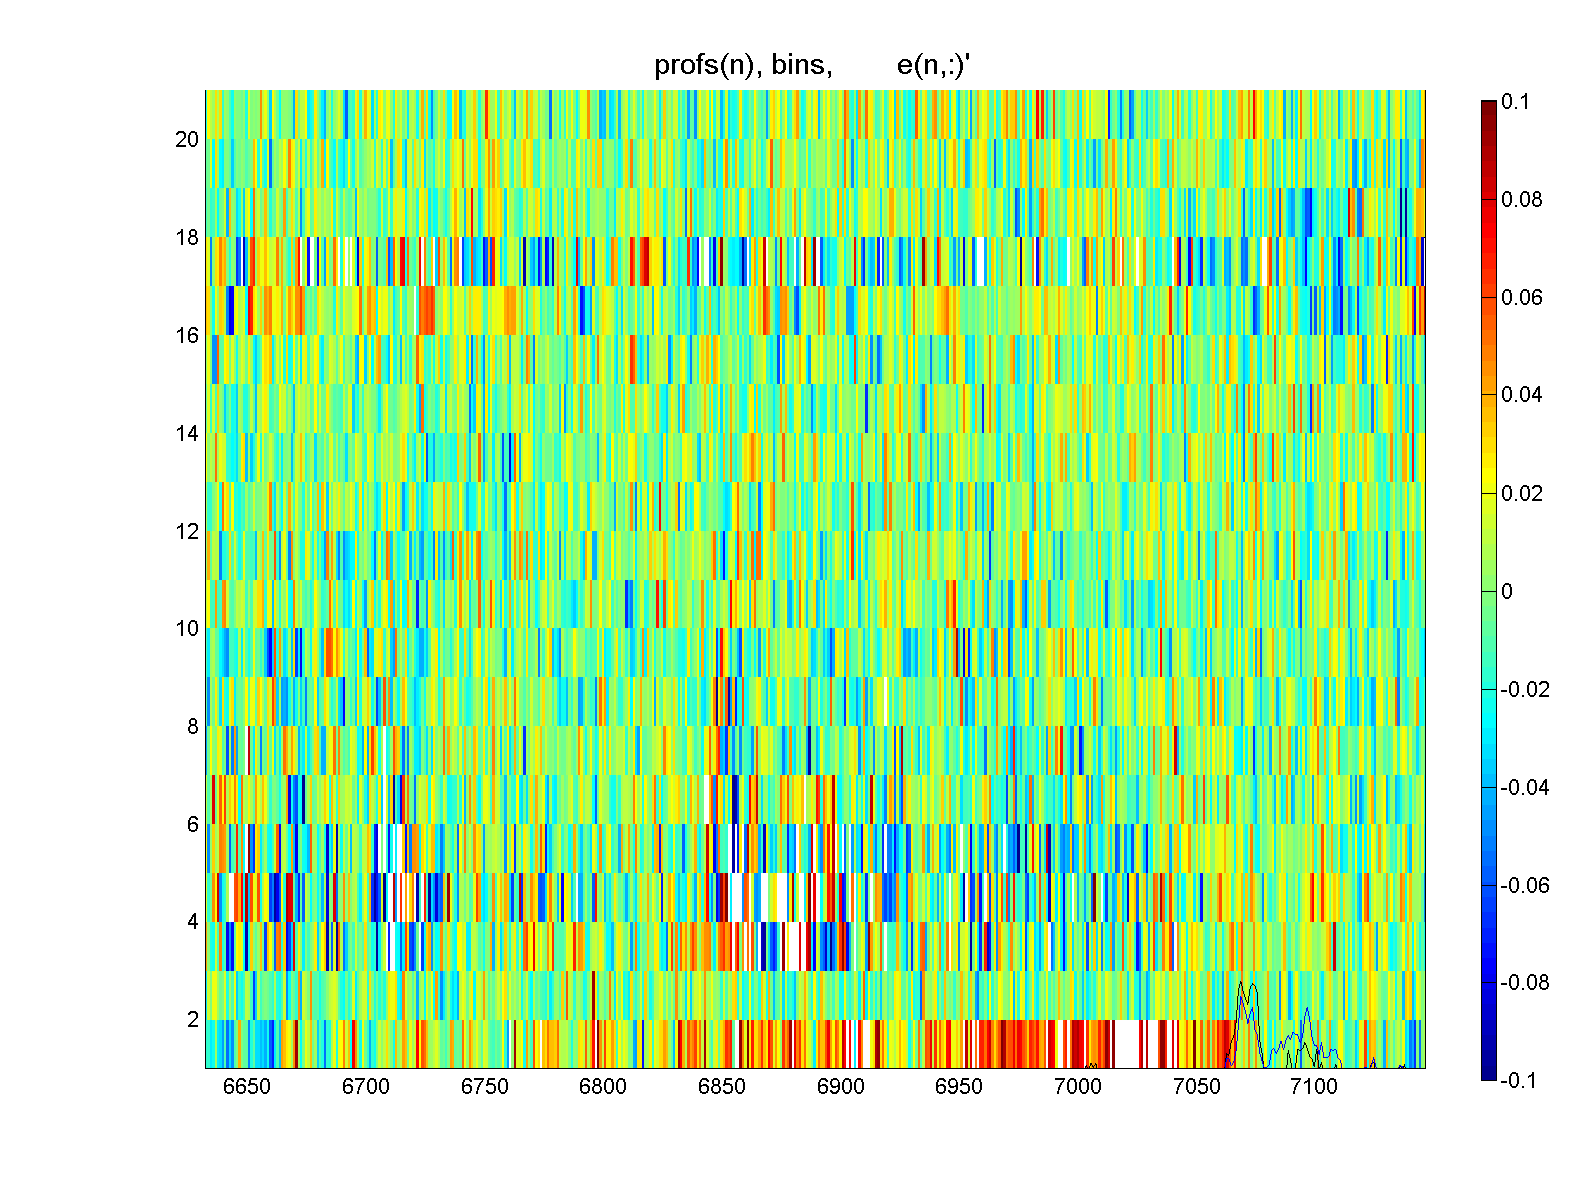
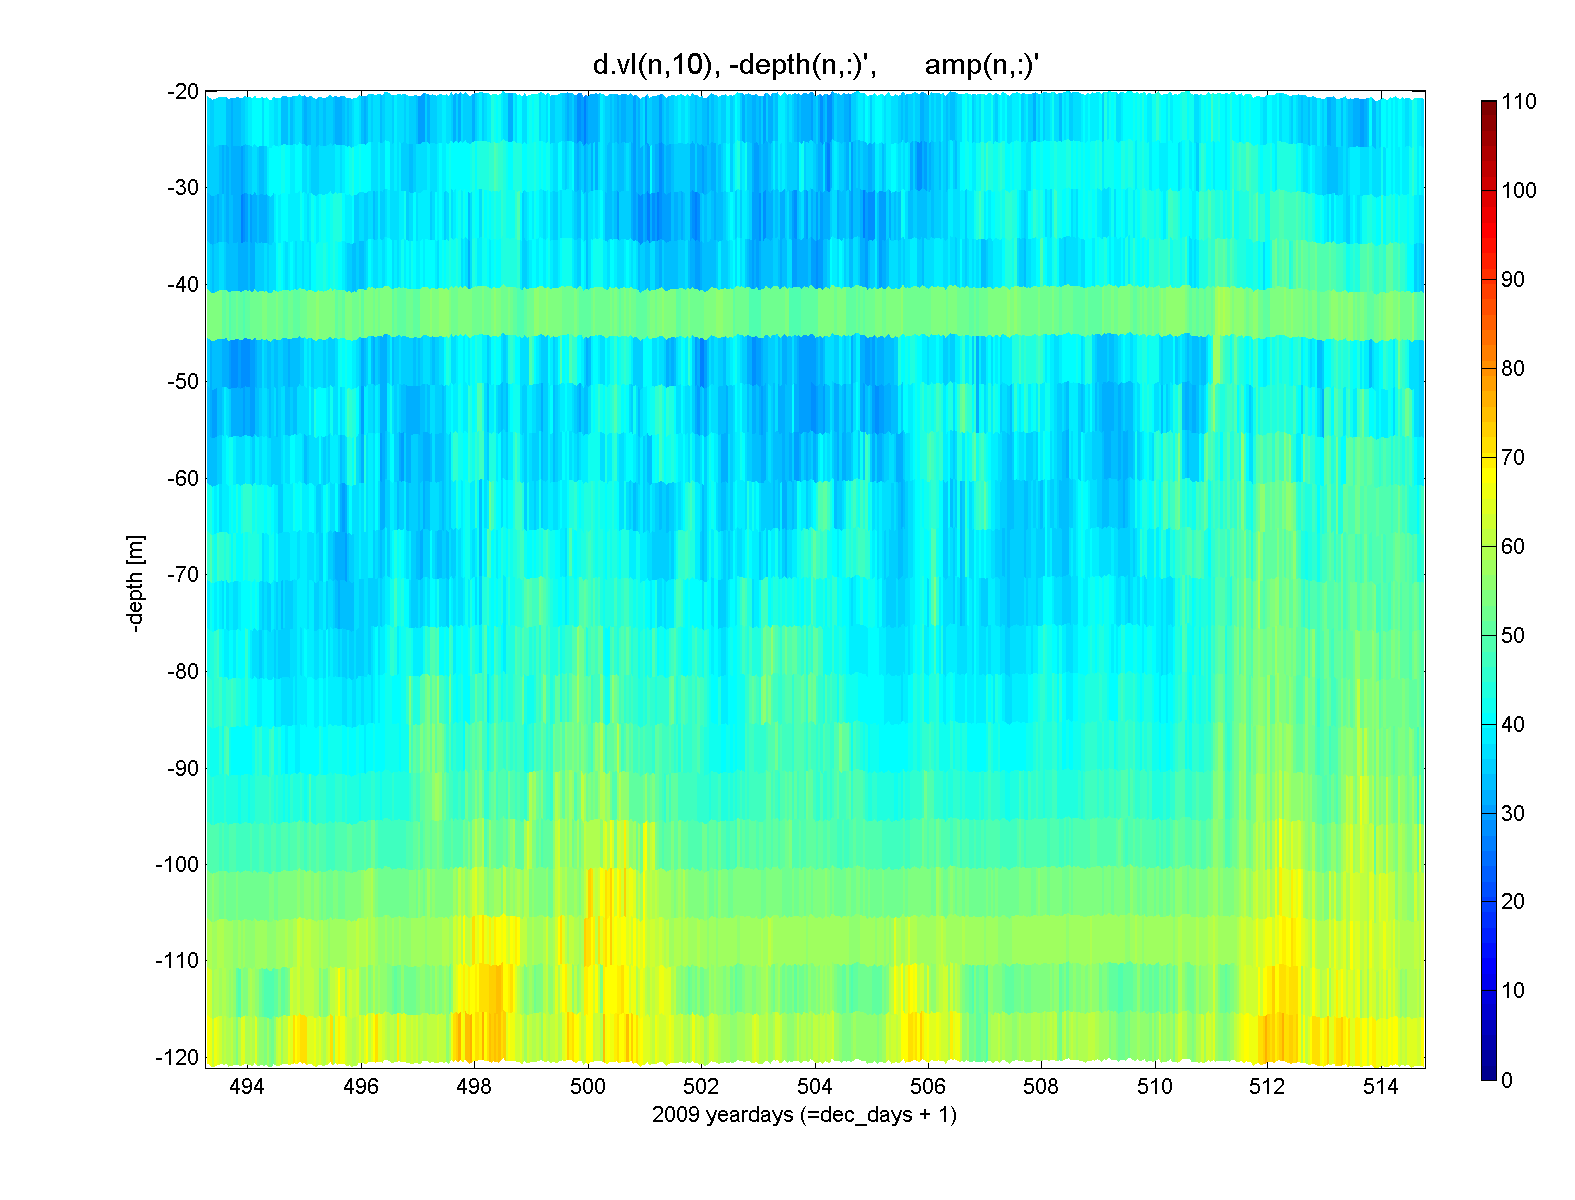
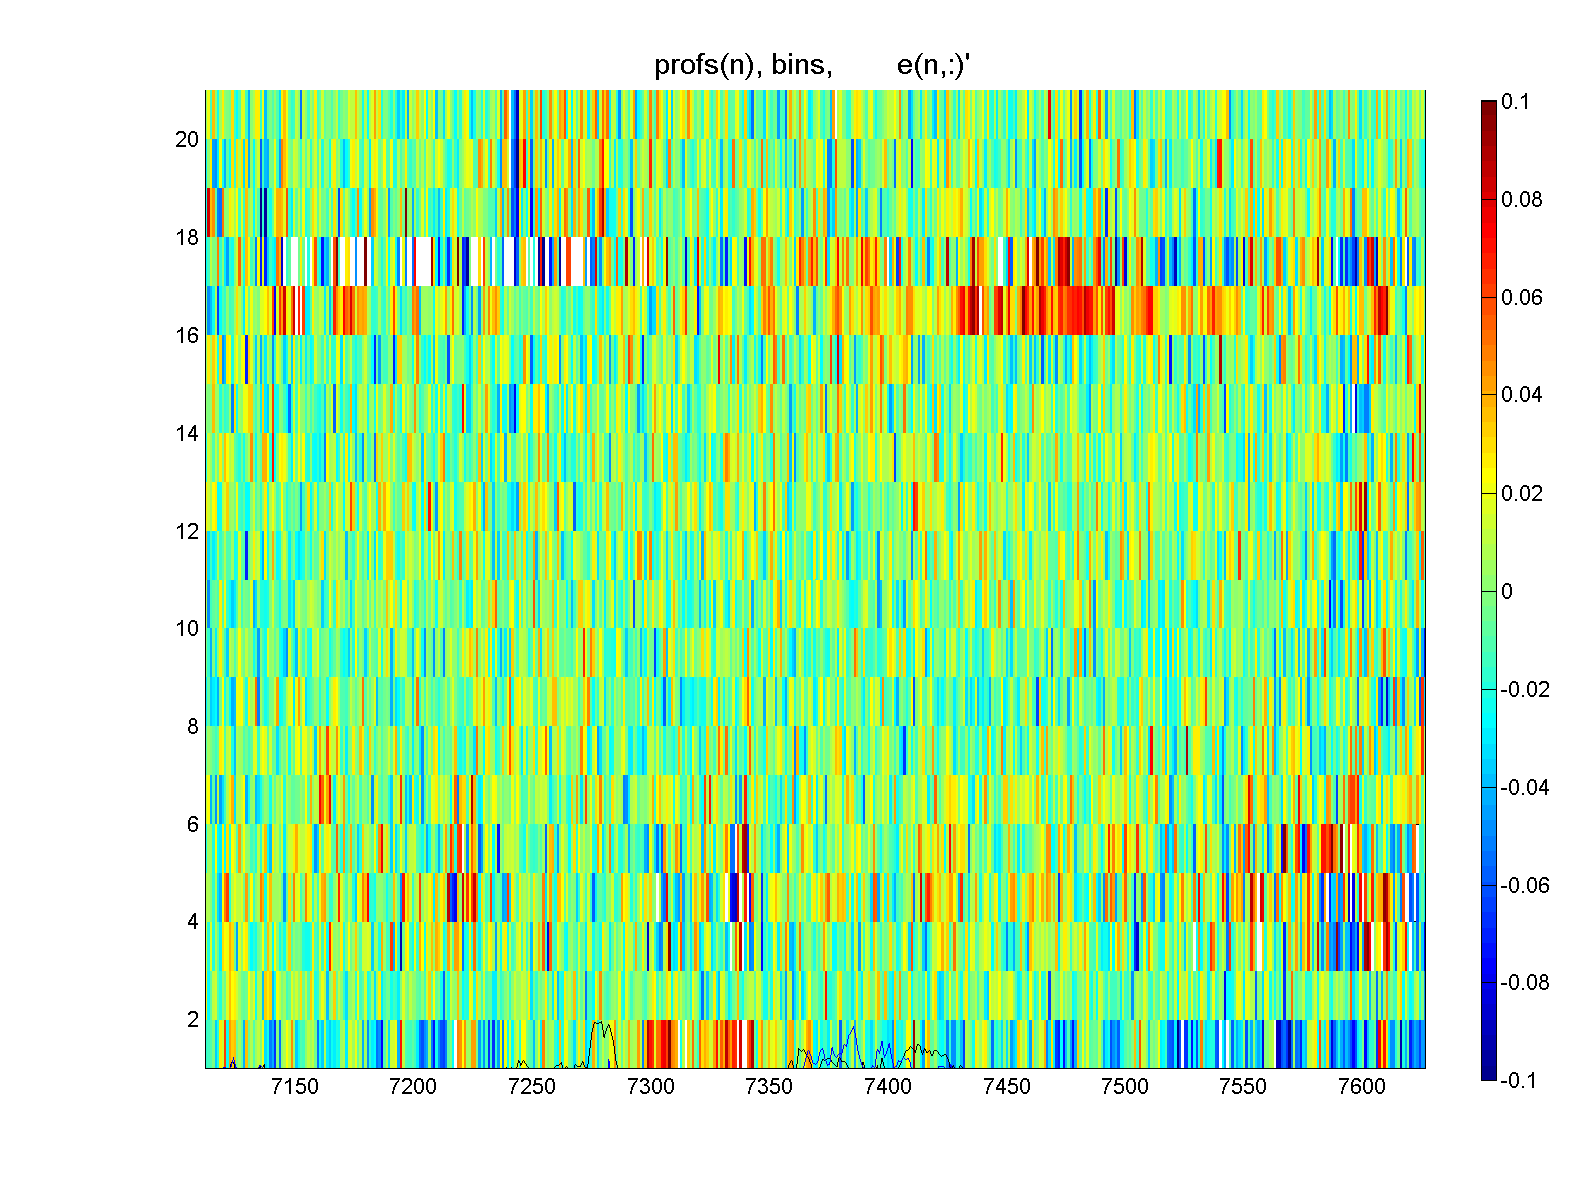
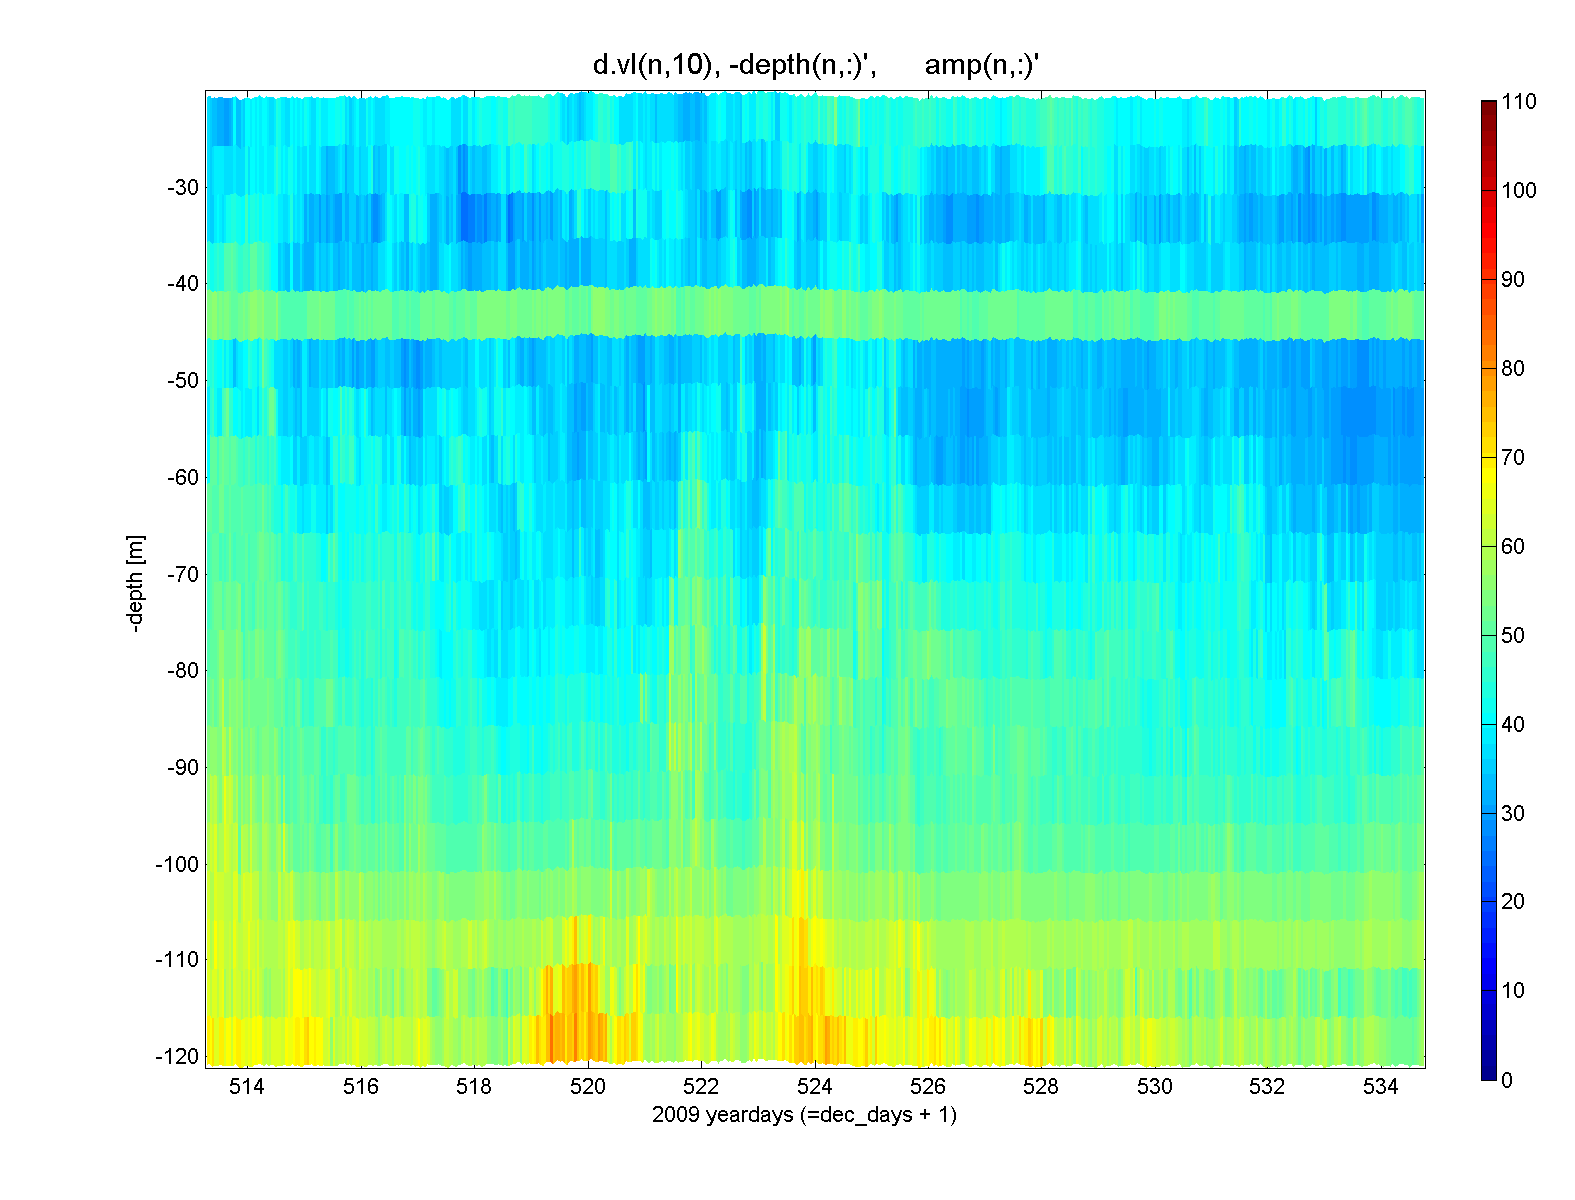
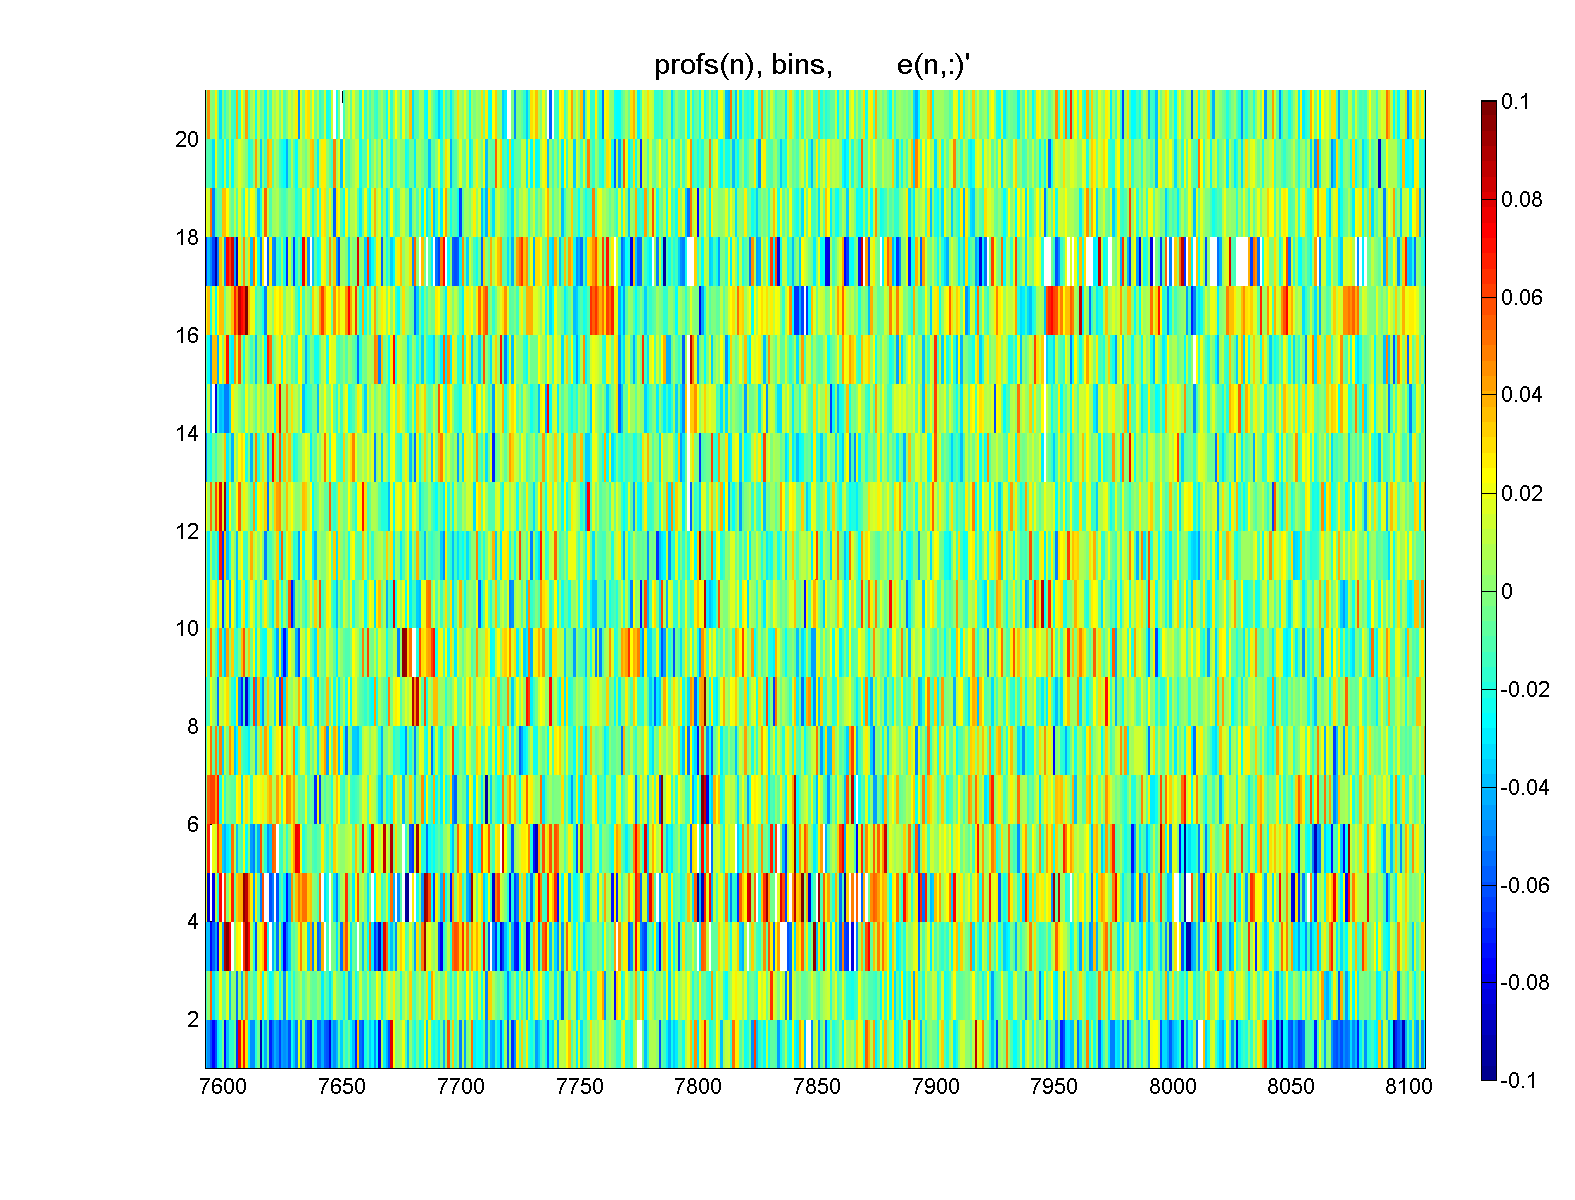
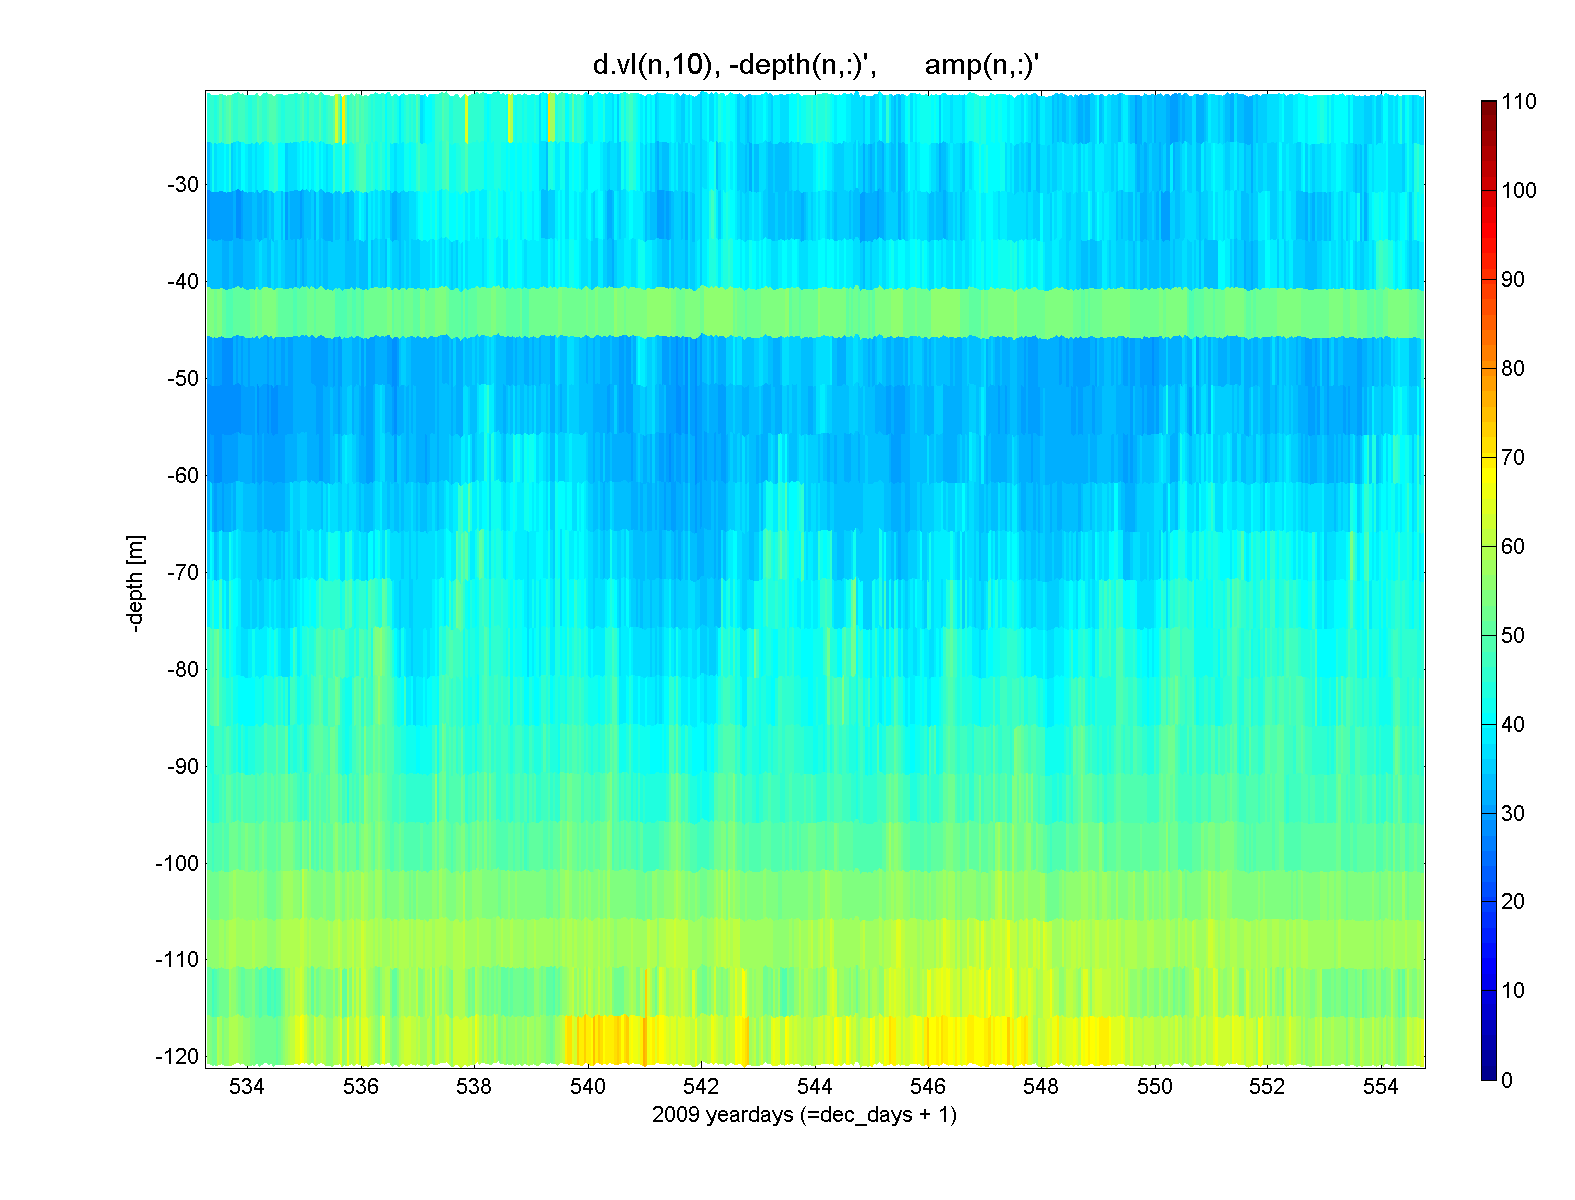
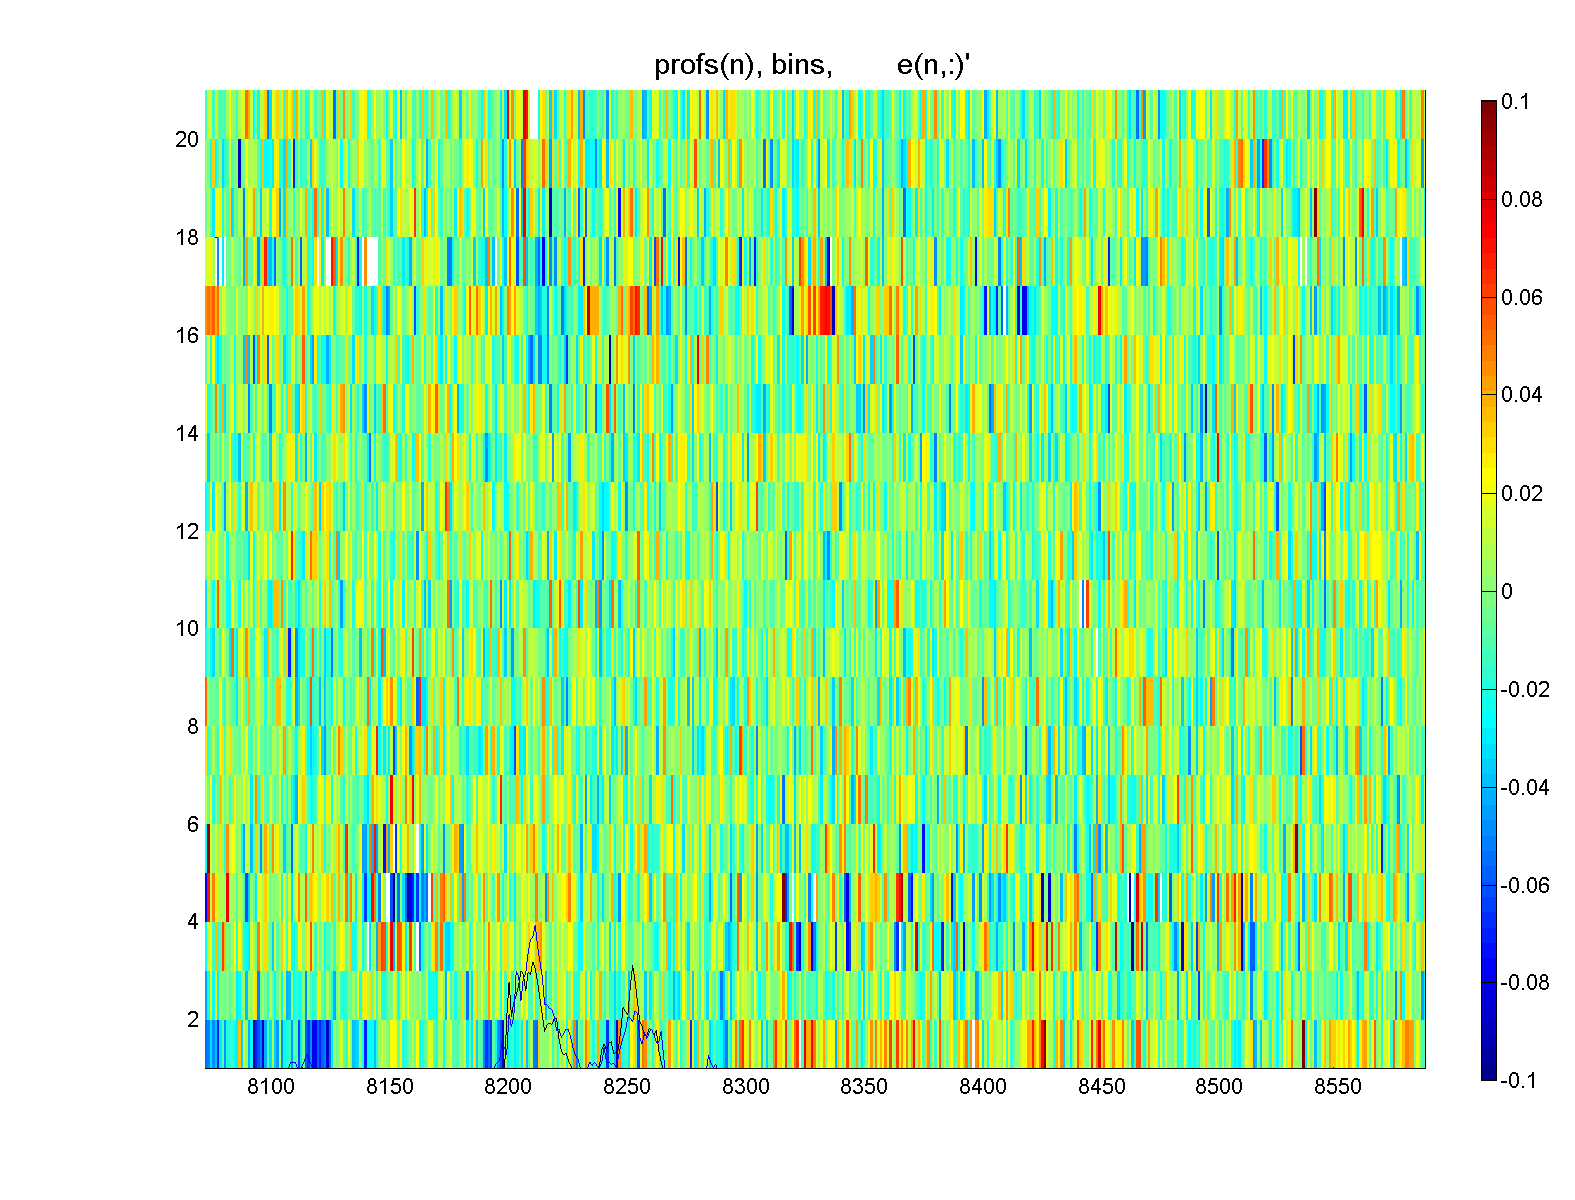
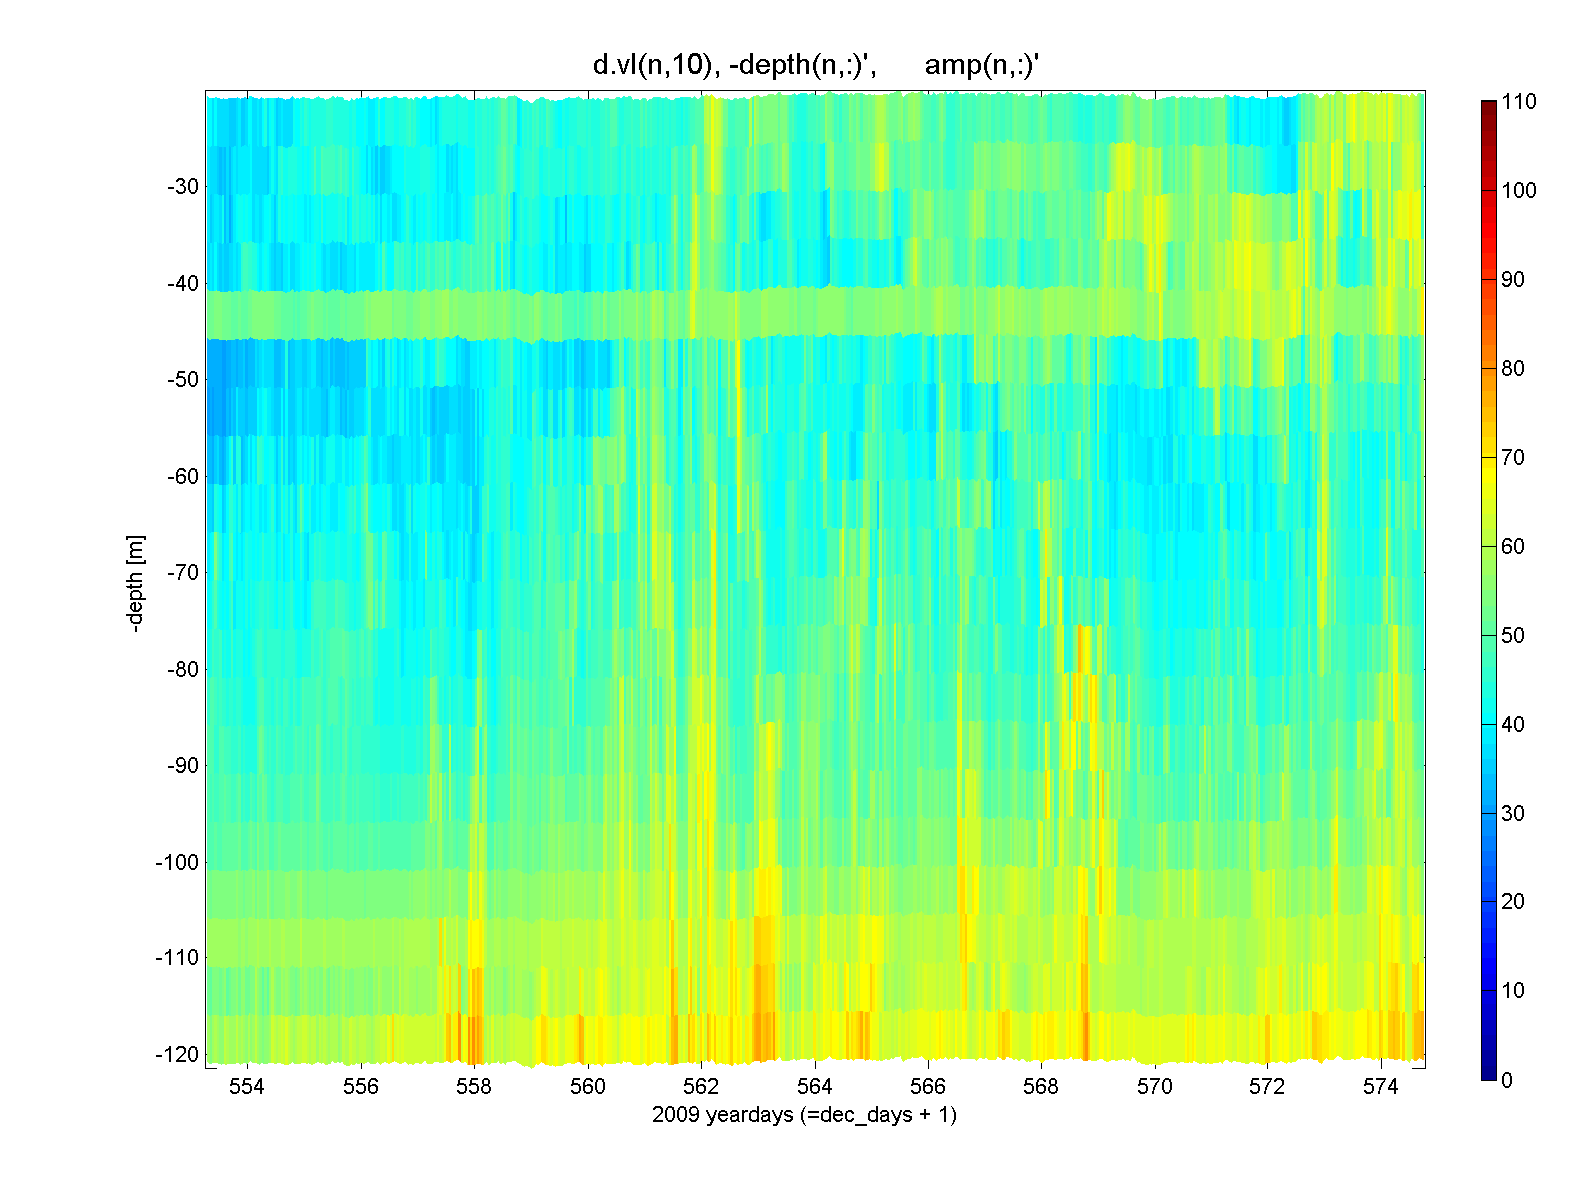
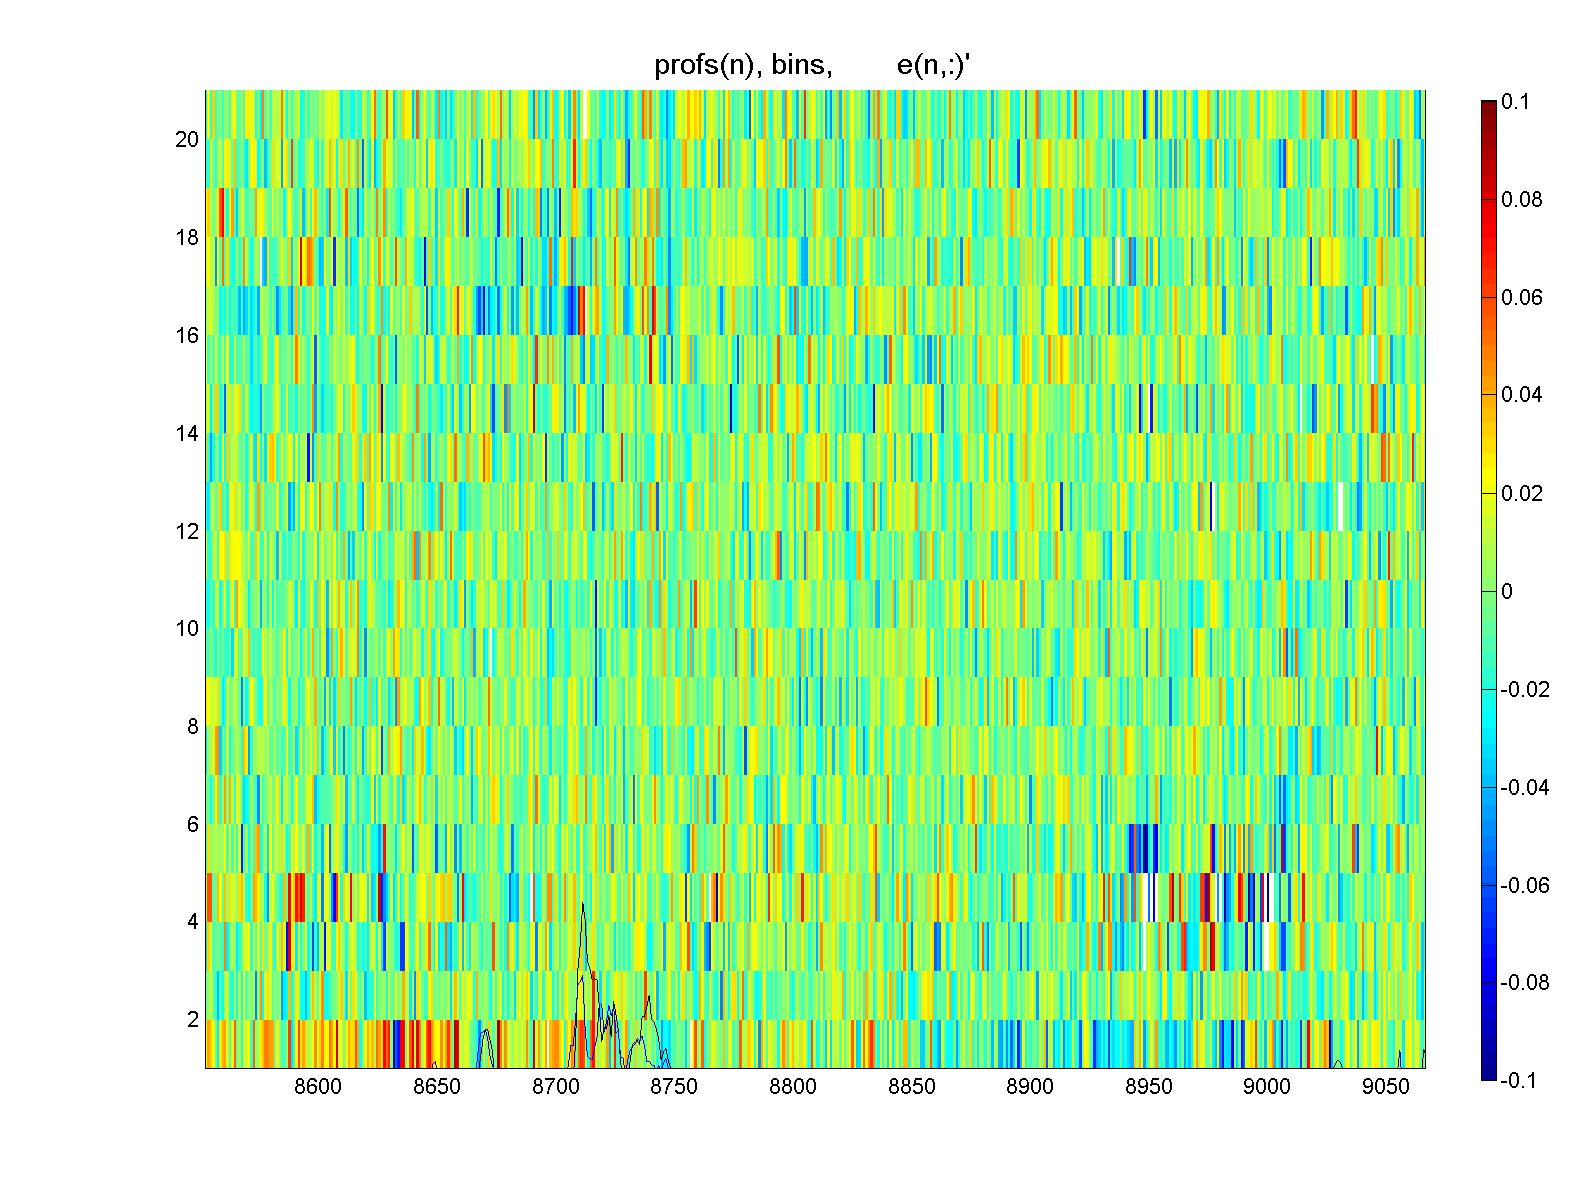
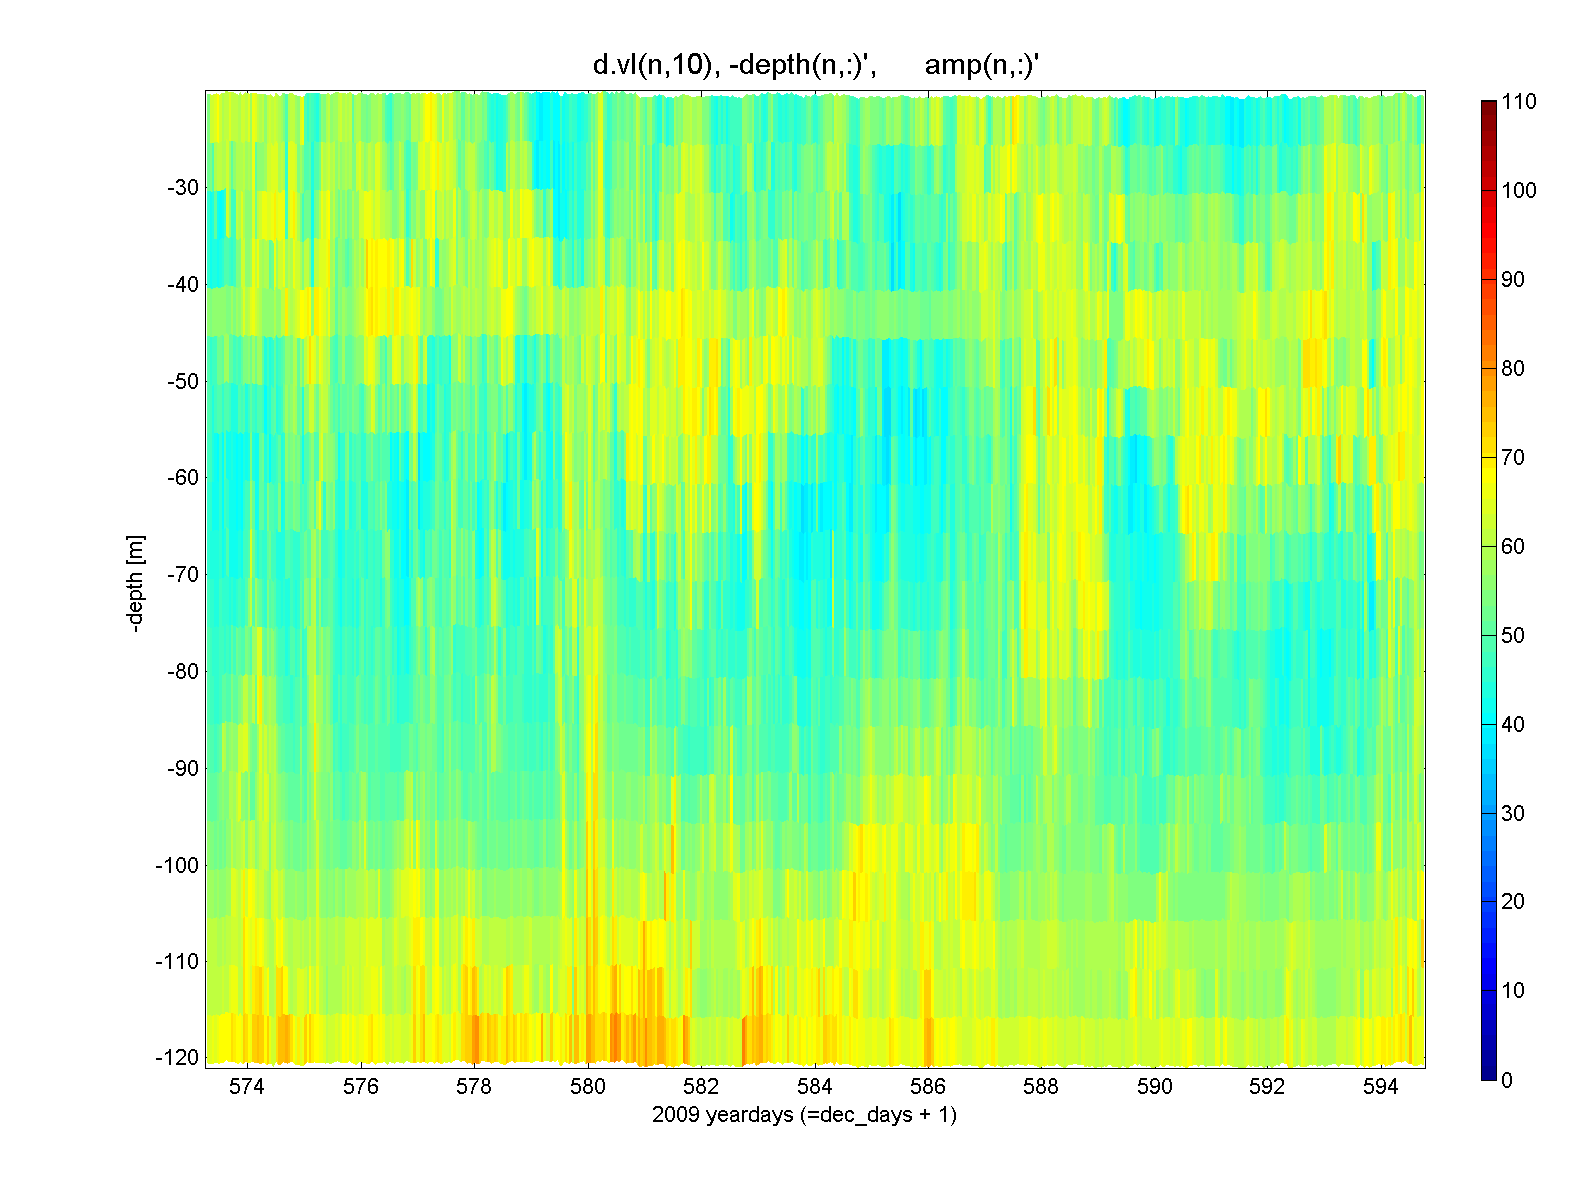
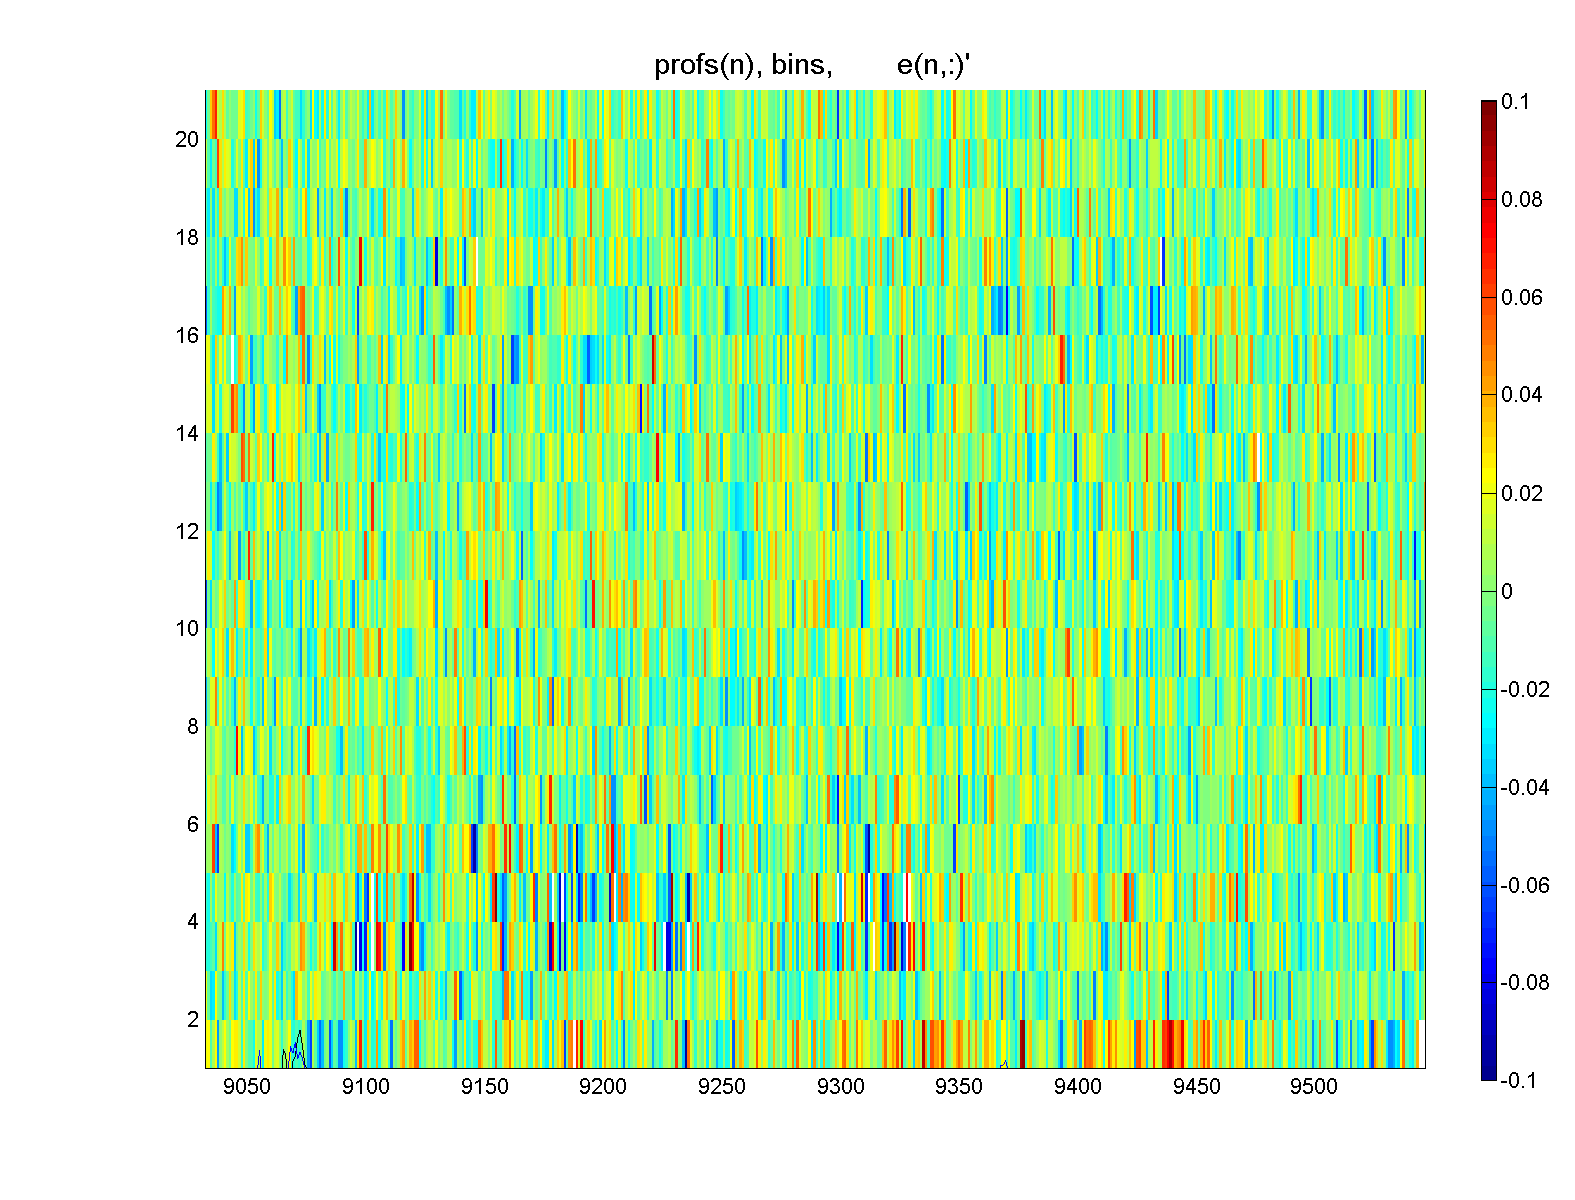
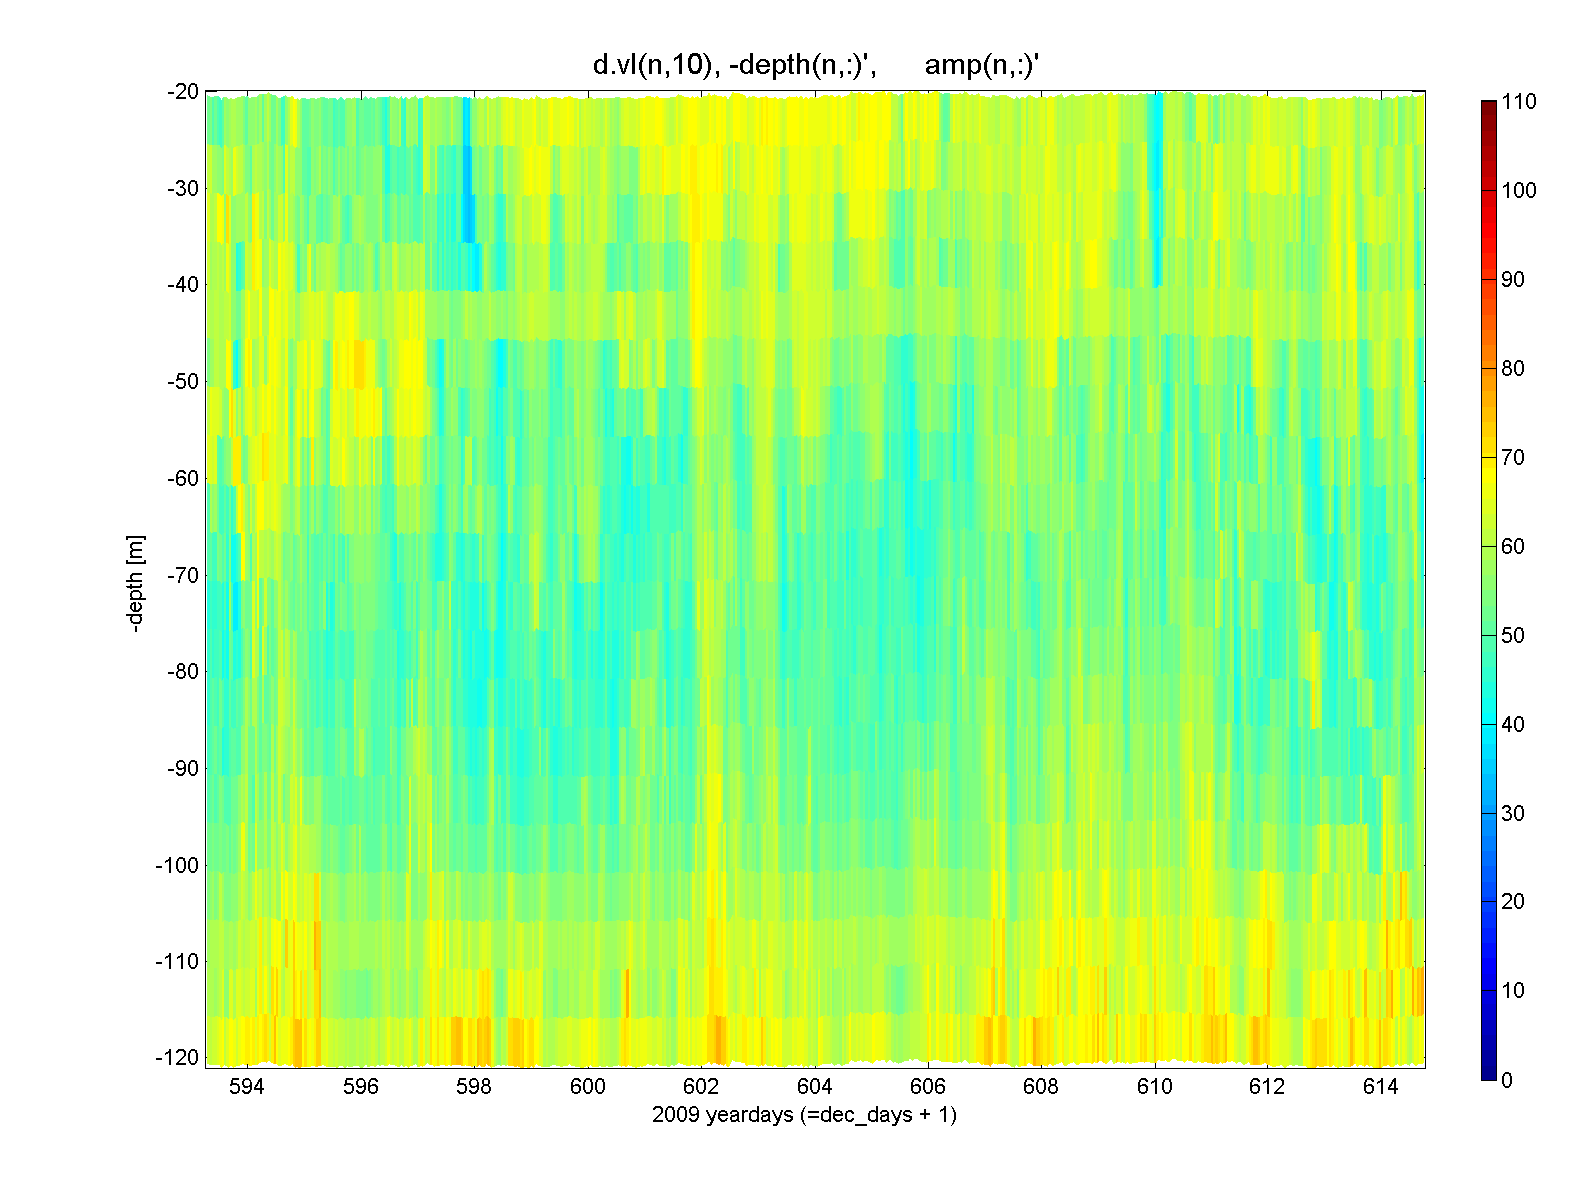
error velocity, and return amplitude
Each row contains 20 days of data for four variables.
NOTE: for a small screen, these rows may wrap!
Vertical coordinates are either bin number of depth in meters.
Horizontal coordinates are dates, profile index, or year days.
The Error velocity figure also includes a line plot of roll and pitch.