Deployment 2018 to 2020
series of eight microcats
final data

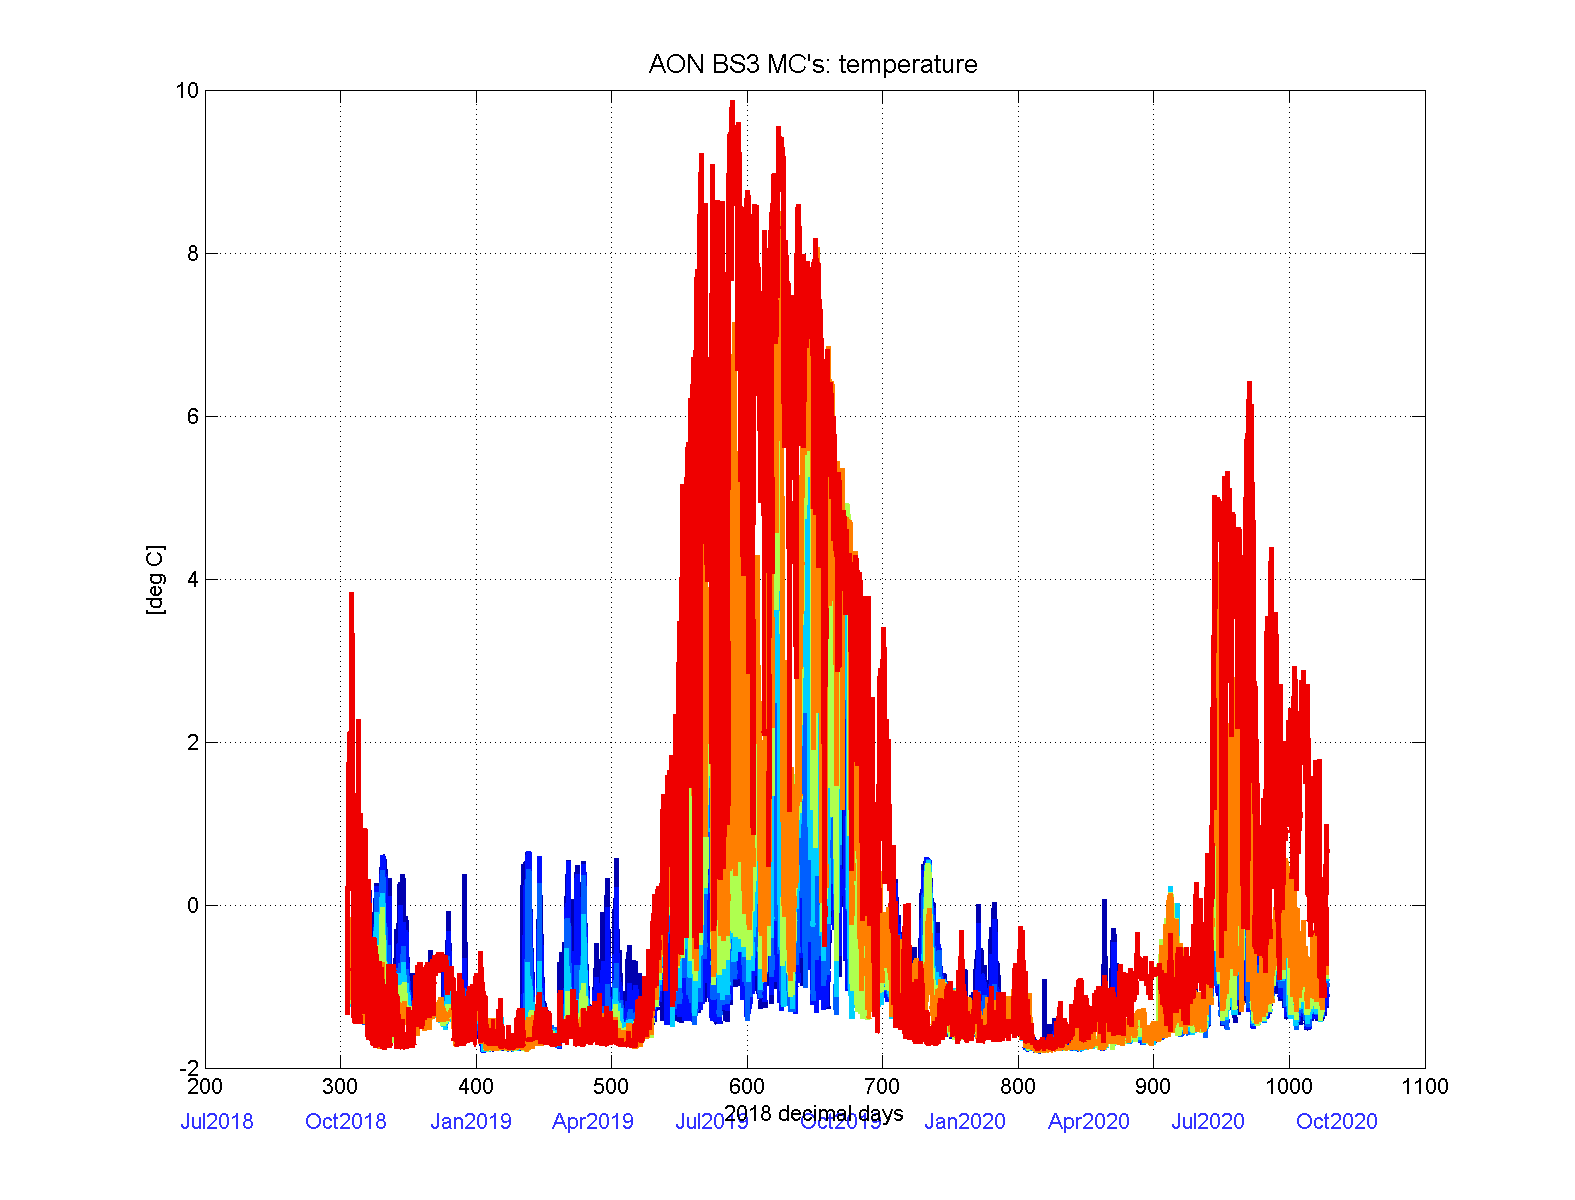
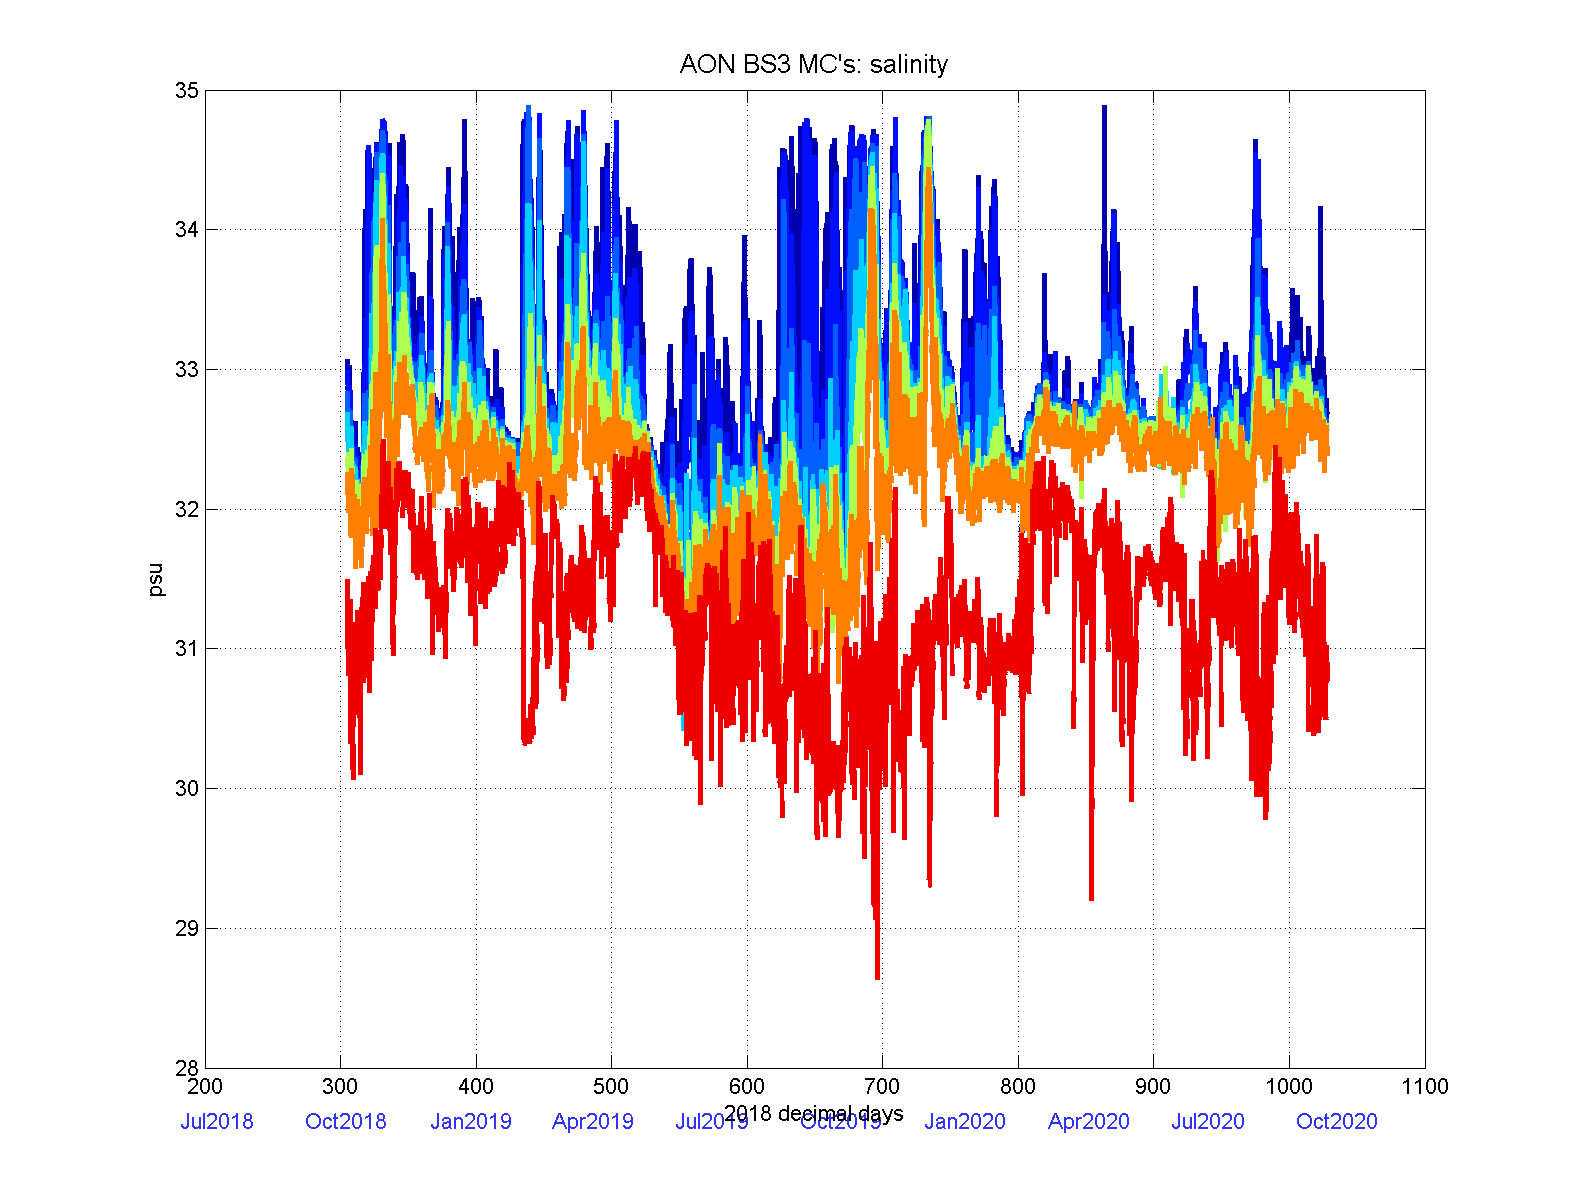
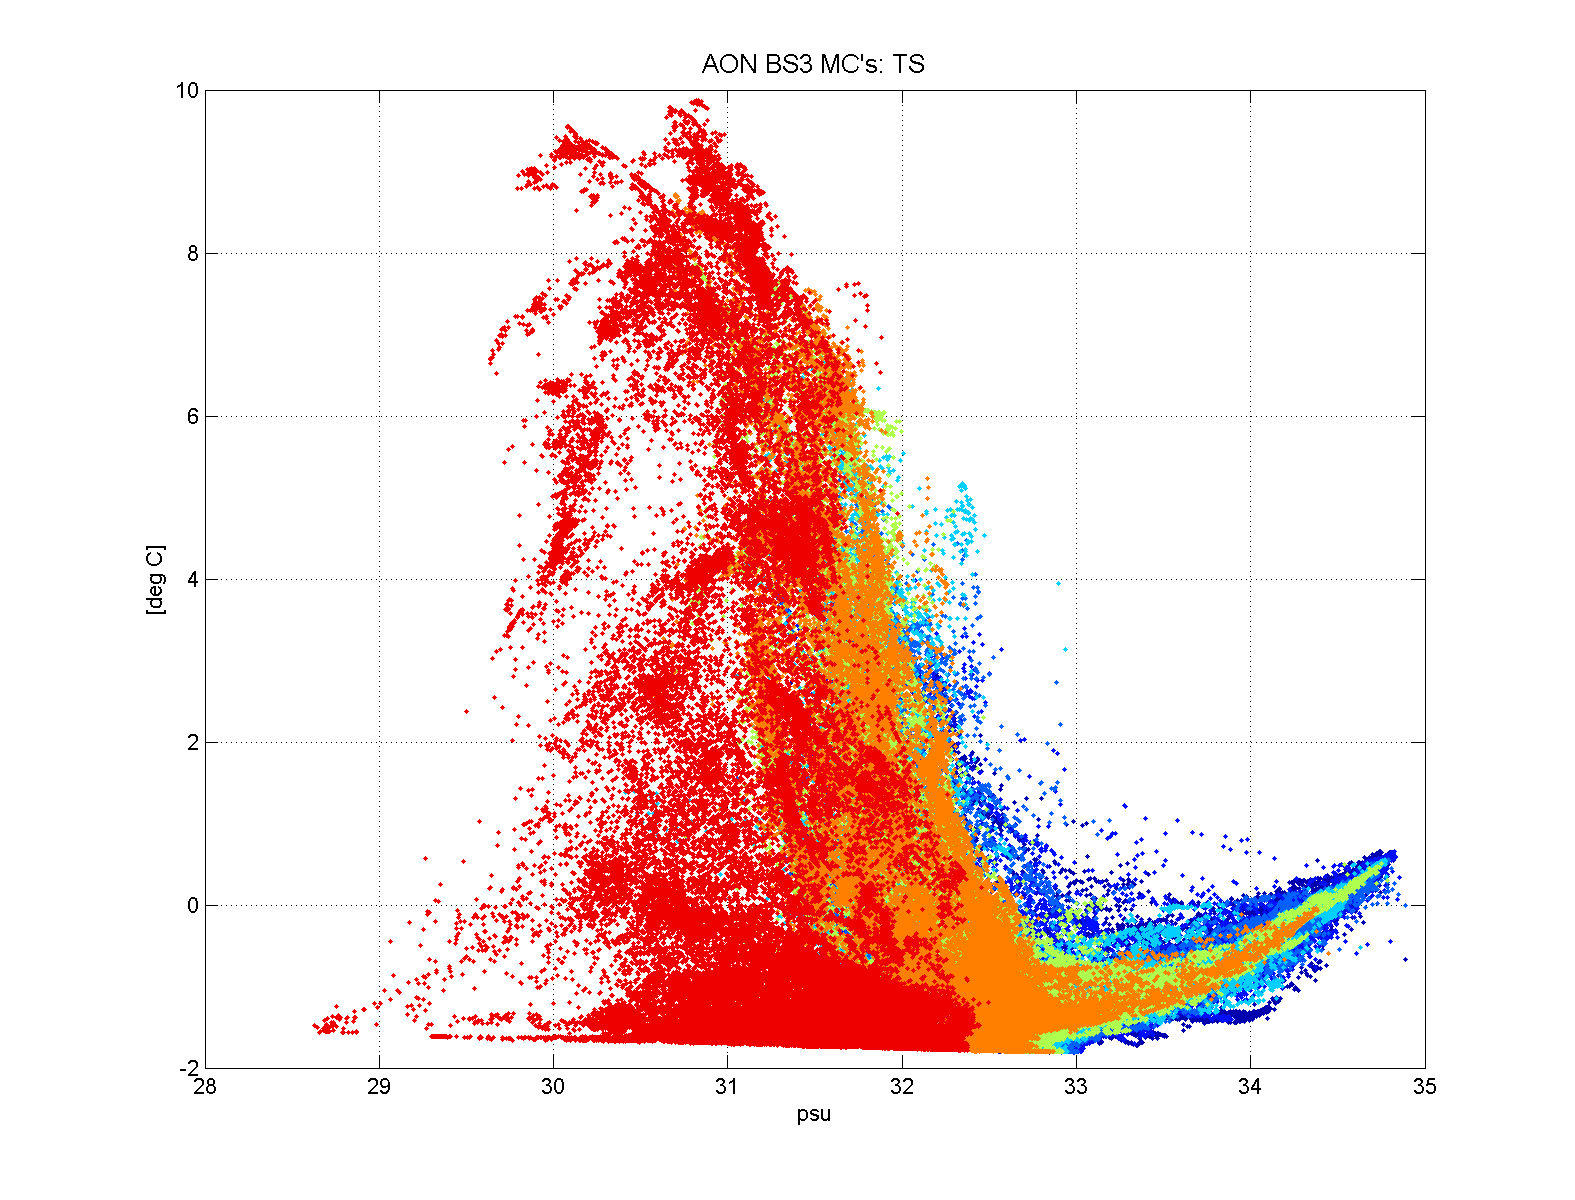
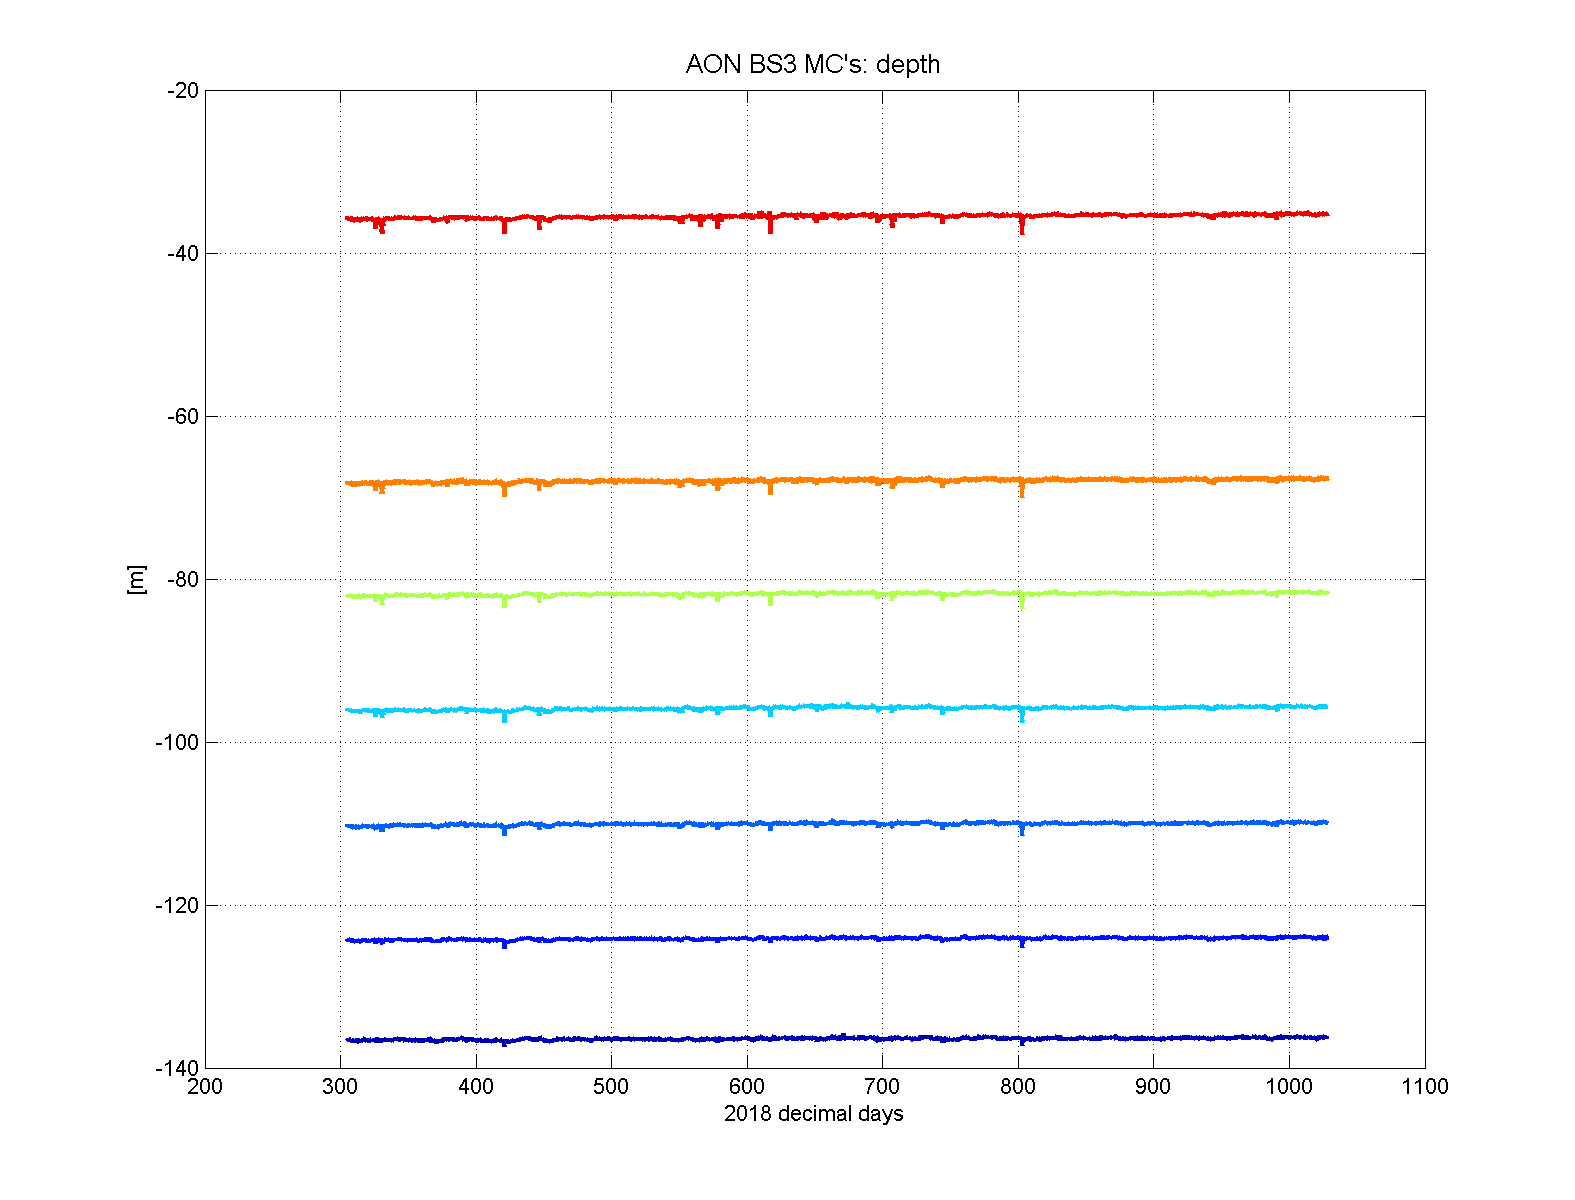
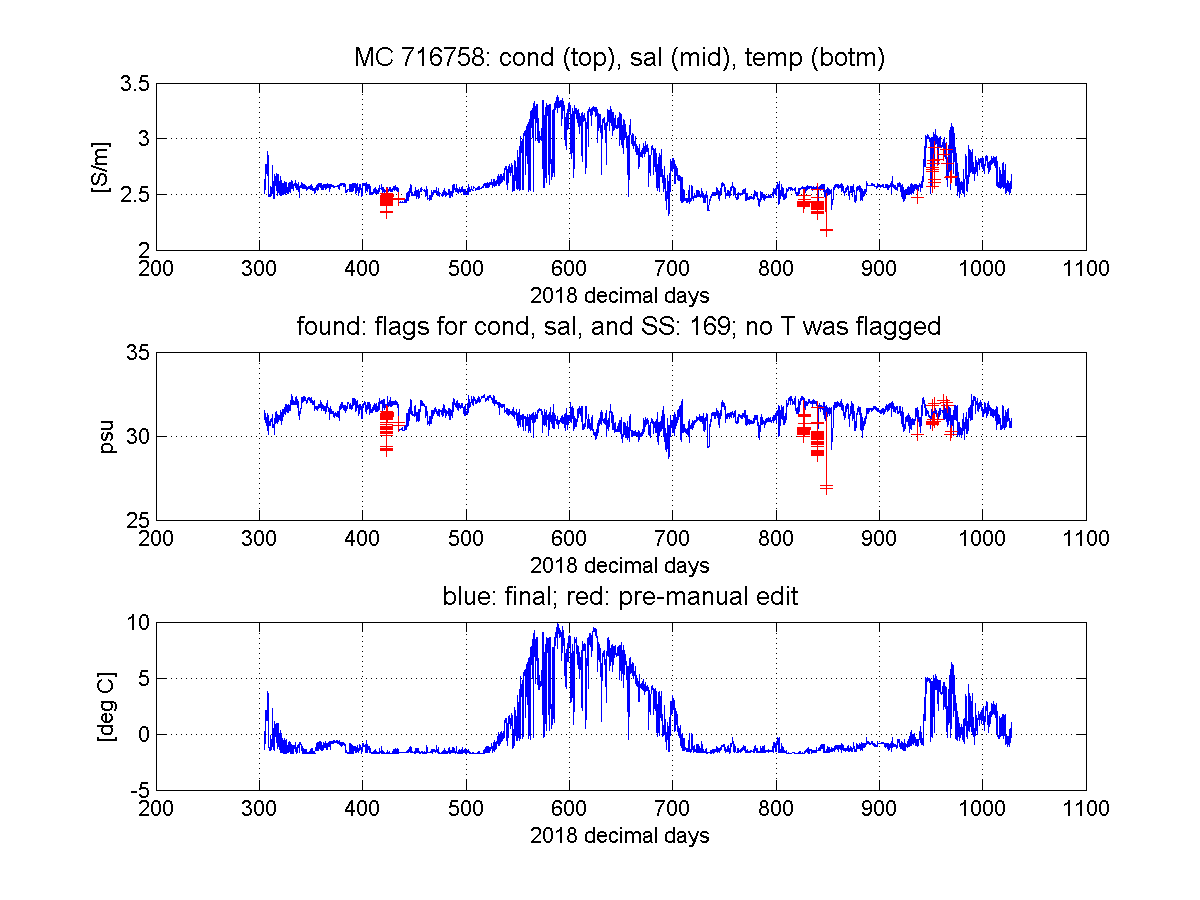
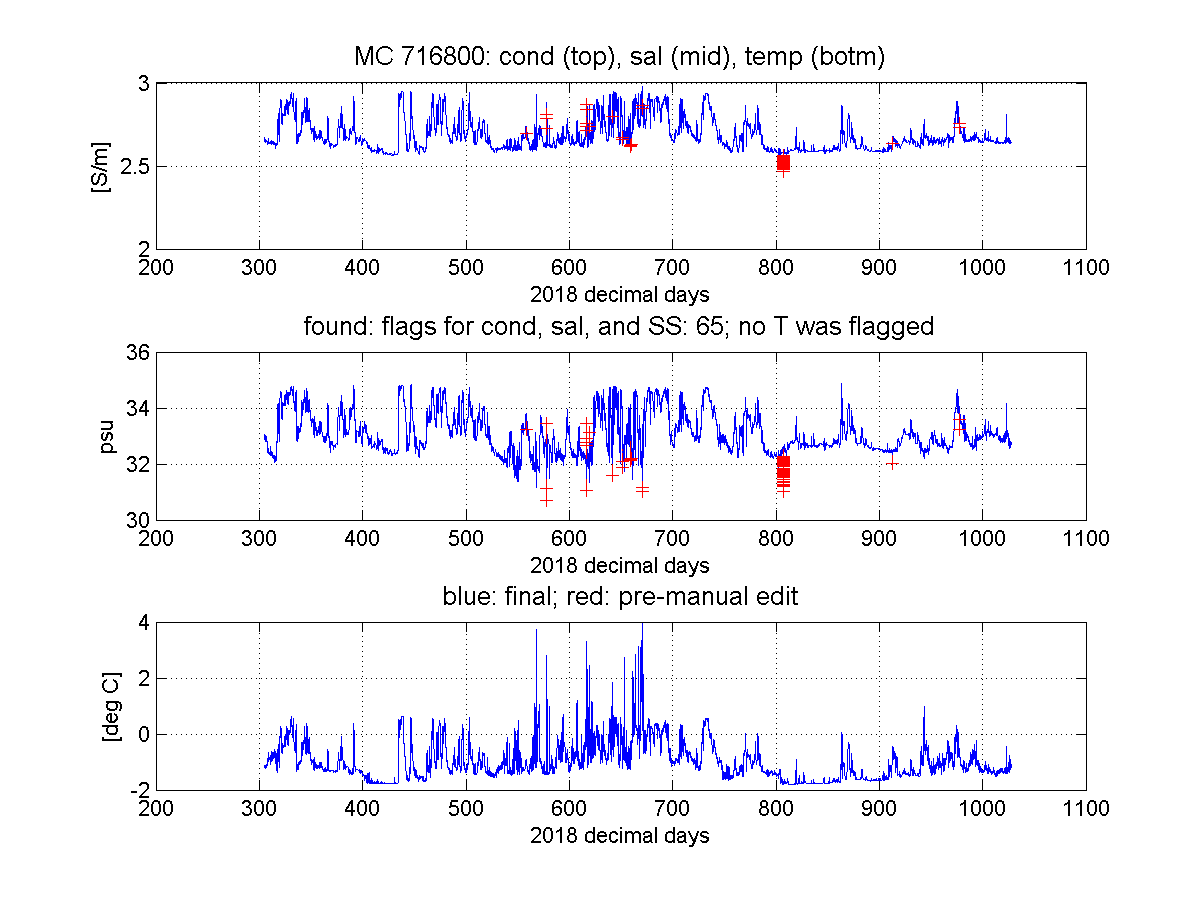
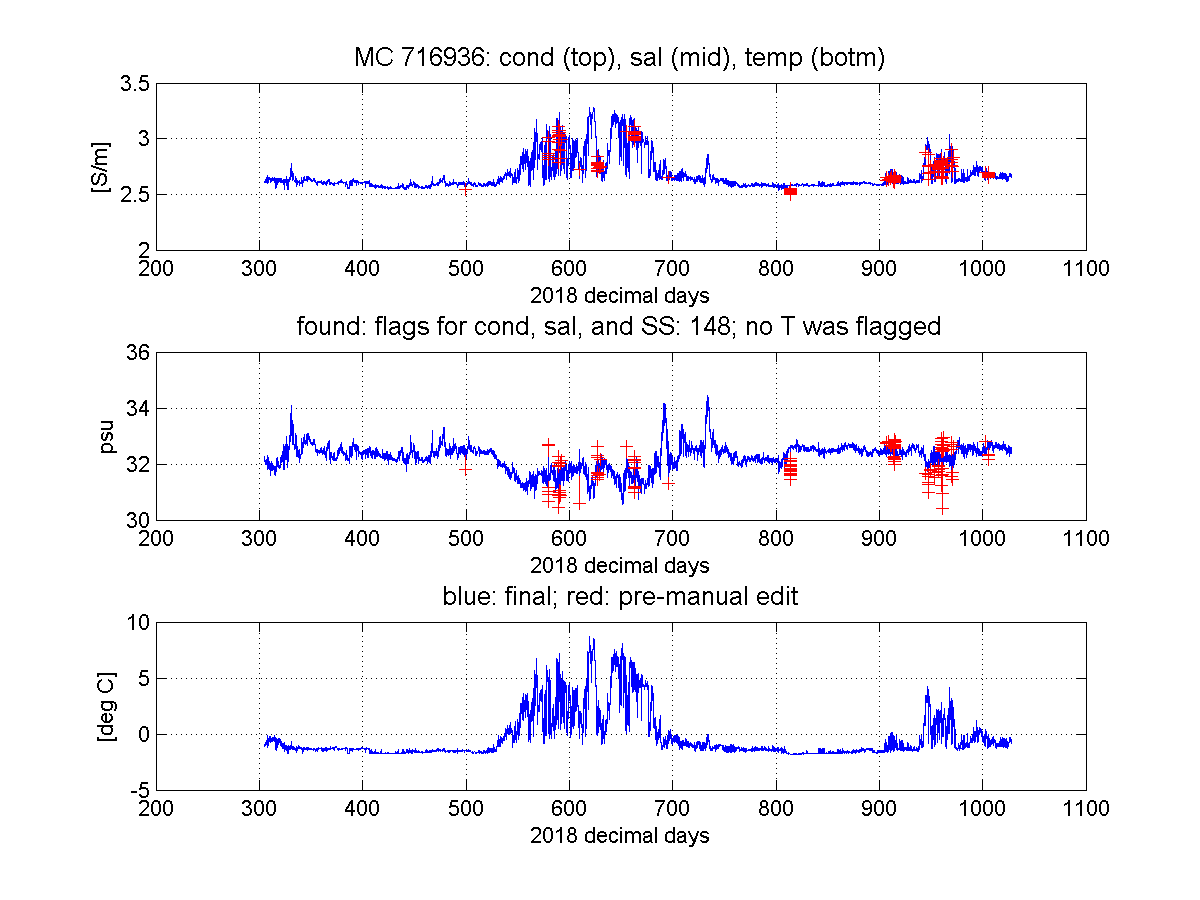
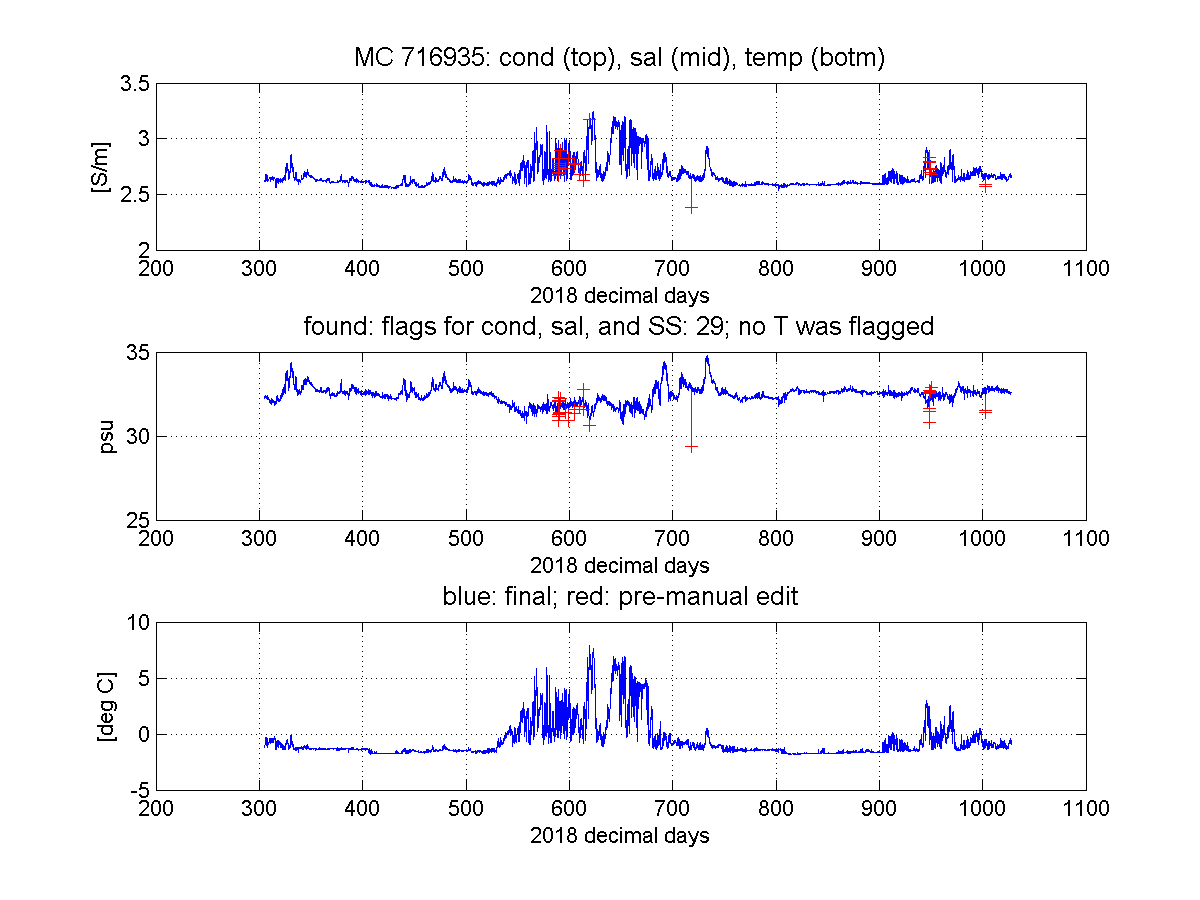
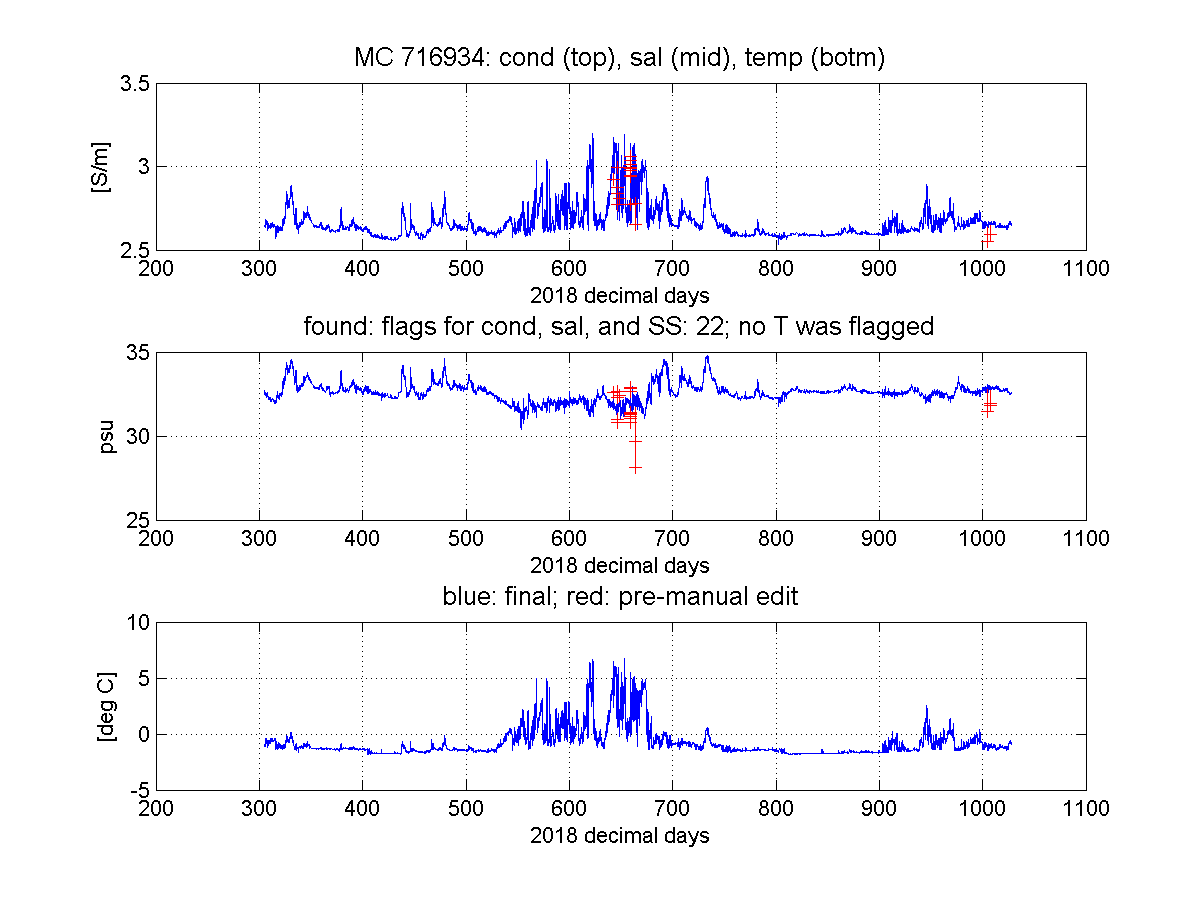
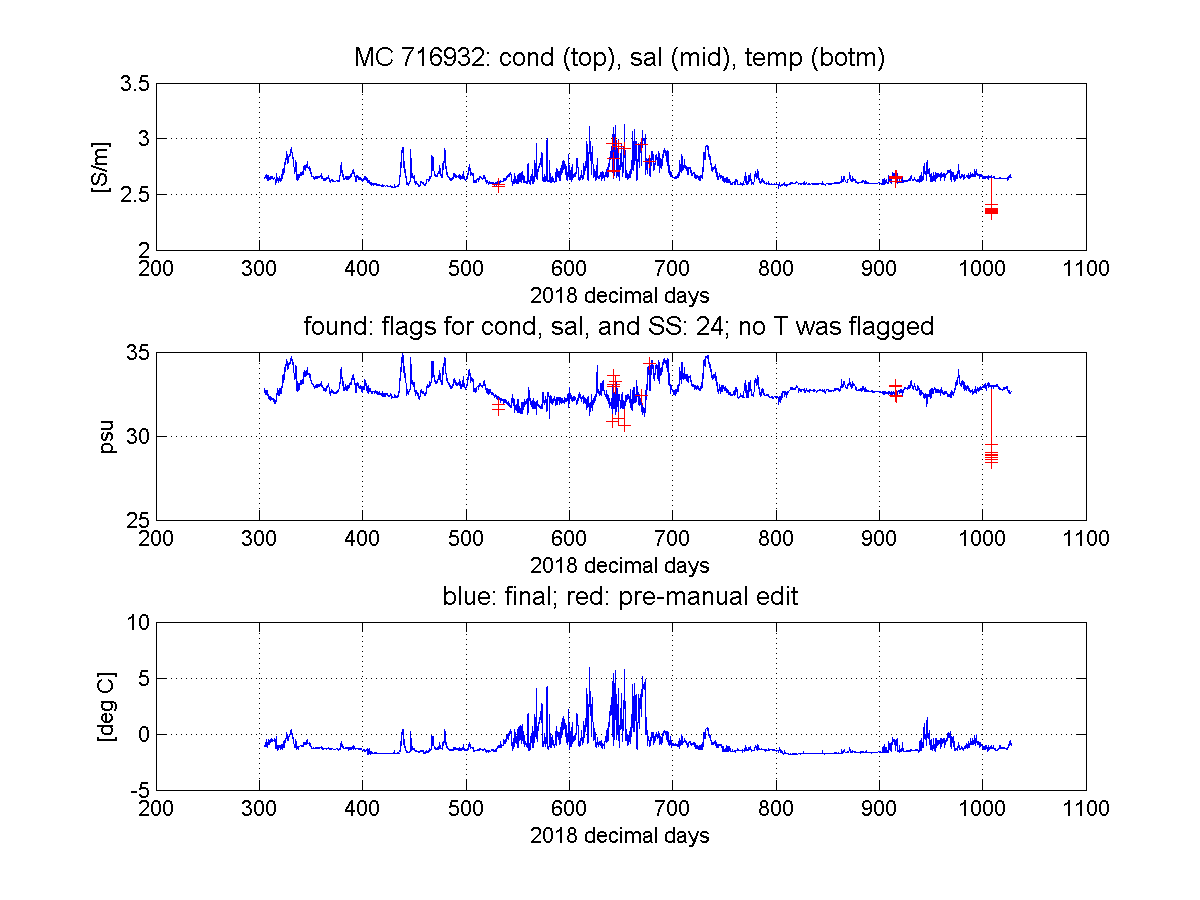
Deployment summary:
Duration: Nov 1, 2018 to Oct 24, 2020
Location: 71° 23.677' N, 152° 3.146' W in 149 meters of water
Variables measured: pressure, temperature, conductivity
Sensor information: SBE37-SM example microcat brochure
Instrument settings: sampling interval 15 minutes
    latitude to use for depth calculation = 71.33 deg;
Calibration: based on pre- and post cruise SeaBird laboratory calibration; described here
Final data: matlab format


Instrument setup:
The following instruments were provided by Brian Hogue's mooring shop:

SBE37SM-RS232 firmware version 3.1 serial no. 16758, deployed on the top sphere at 35m
SBE37SM-RS232 firmware version 3.1 serial no. 16937, deployed on the wire at 51m; flooded
SBE37SM-RS232 firmware version 3.1 serial no. 16936, deployed on the wire at 67m
SBE37SM-RS232 firmware version 3.1 serial no. 16935, deployed on the wire at 81m
SBE37SM-RS232 firmware version 3.1 serial no. 16934, deployed on the wire at 95m
SBE37SM-RS232 firmware version 3.1 serial no. 16932, deployed on the wire at 109m
SBE37SM-RS232 firmware version 3.1 serial no. 16930, deployed on the wire at 123m
SBE37SM-RS232 firmware version 3.1 serial no. 16800, deployed on the ADCP cage at 135m

They were configured to record temperature, conductivity, and pressure
at 15-minute intervals.


Data processing and calibration:

Following recovery, the microcat data were downloaded onboard Sikuliaq by Dan Torres.
One of the instruments, ser# 16937 deployed at 51m, was found to have flooded.
A clock check indicated that all microcat clocks were accurate to within 1 minute.
Dan provided this excel sheet with sensor information.

Post-processing indicated that the conductivity record of mc ser# 169630 at 123m depth
had dropped to unrealistically low numbers for the last month and was set to NaN. In
addition, a typical number of smaller salinity spikes, likely due to short-term
conductivity cell fouling, were edited out as well.

The plots below identify manual edits in red for conductivity (top) and thus salinity (middle).
No temperature edits were made for this deployment. The plots are arranged by
instrument deployment depths going from shallowest to deepest.


Both temperature and conductivity sensor drift was estimated by comparing pre- and post-
deployment lab calibrations at SeaBird, described here in more detail. Overall drifts
were small. Unfortuately, a post-deployment cal for 16930's conductivity sensor could not
be obtained due to the late failure of the instrument. After the record up to the last
month was found to be realistic, a typical conductivity drift was applied and verified by
comparing its TS record to that of the other microcats.


Data access
Each microcat dataset was saved in the familiar format of one instrument
per matlab .mat file. On-deck times prior to deployment and after recovery
were nan'ed out. The data files can be found here.