

Deployment 2016 to 2018:
Upward looking sonar "IPS4"
Upward looking sonar "IPS4"
 |
 |
plots curtesy of Rick Krishfield
|
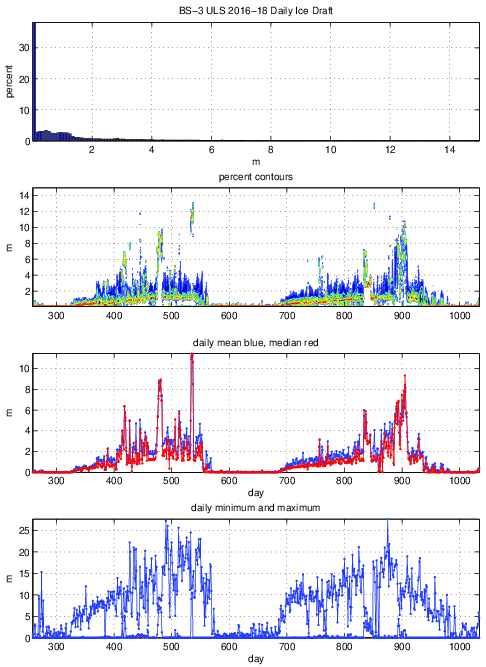
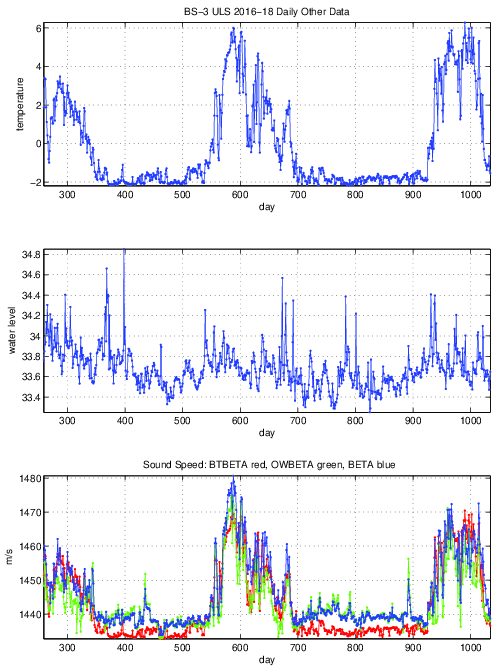
Deployment summary: Duration: Sept 8 2014 to Oct 30 2016 Location: 71 23.661 N, 152 3.04 W Variables measured: ice draft; also records pressure and temperature Sensor information: IPS4 serial # 1043; see also IPS4 manual Instrument settings: ping interval: 2; pressure interval: 20 Processed data were provided by Rick Krishfield (HWOI) in two formats: 1) ascii 2-second ice draft time series are contained in the compressed file bs3uls18_draft.zip ; 2) daily averages including statistics in matlab format can be found in bs3uls18_daily.mat" Their format is described here. |
|
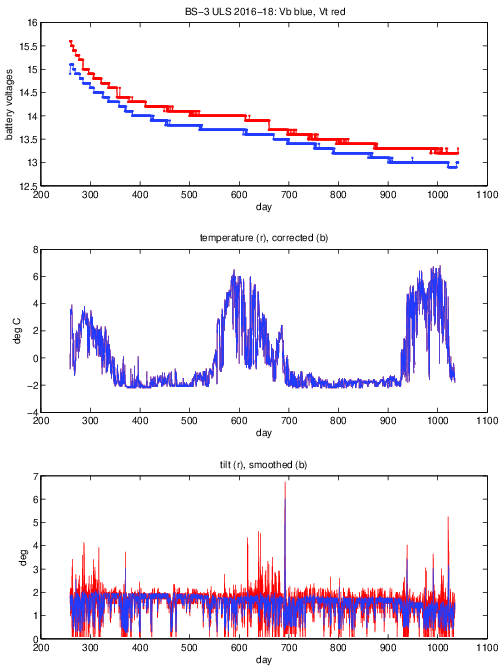
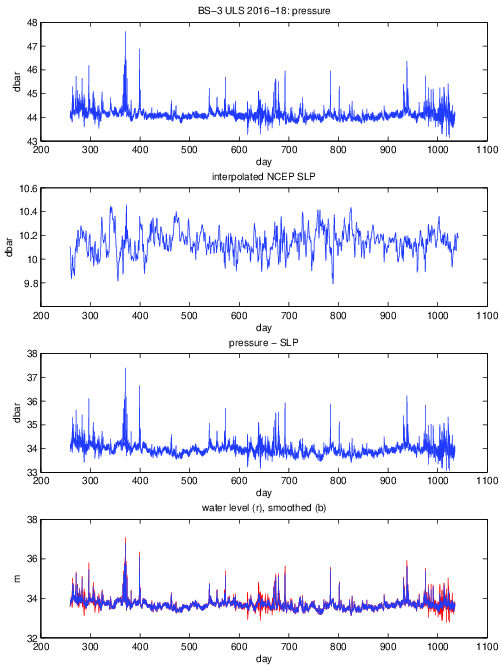
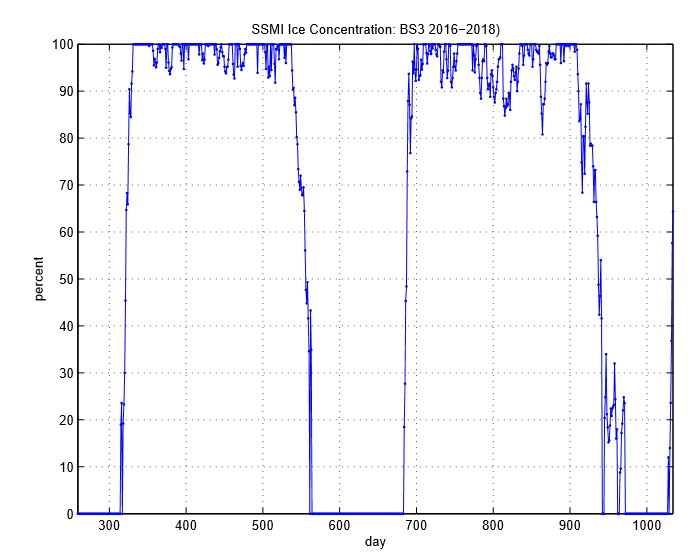
Data processing: The data was post-processed by Rick Krishfield at WHOI, who emailed the following comments: The MAT file has the daily information, while the tar and zip files have the full 4 second dataset. The PS plots based on the daily data are also attached. The processing procedures and data format are described briefly at https://www.whoi.edu/page.do?pid=66566 and in full detail at https://www.whoi.edu/fileserver.do?id=85684&pt=2&p=100409. [fb insert: see local copies of the text from the ITP web page with brief notes, and the full detail version in the BGOS ULS Data Processing Procedure]. If it is published, I would appreciate a reference to my ice draft paper which also has a detailed appendix on the processing procedures: Krishfield, R.A., A. Proshutinsky, K. Tateyama, W.J. Williams, E.C. Carmack, F.A. McLaughlin, and M.-L. Timmermans, 2014. Deterioration of perennial sea ice in the Beaufort Gyre from 2003 to 2012 and its impact on the oceanic freshwater cycle. Journal of Geophysical Research, Vol. 119, doi:10.1002/2013JC008999. You may notice frequent ice drafts throughout the summer when you might expect the site to be free of sea ice. These are often associated with a lot of wobble in the mooring sphere (see attached plots prs1 for tilt and prs2 for vertical deviations) which can cause spurious ice drafts, so I can't be sure that everything in the data set (reflected in the minimum daily ice drafts in the bottom panel of daily1.ps [fb: top left]) is truly ice, and shipping traffic, seals, whales, etc. could all appear as targets. On the other hand, daily ice concentrations from SSMI (attached plot icfrtn.png) also show less than 100% often throughout the summer periods, so these spurious ice drafts could be real. Looking back at previous BS3 datasets that I produced for you it seems that this summer ice is rather typical. |