|
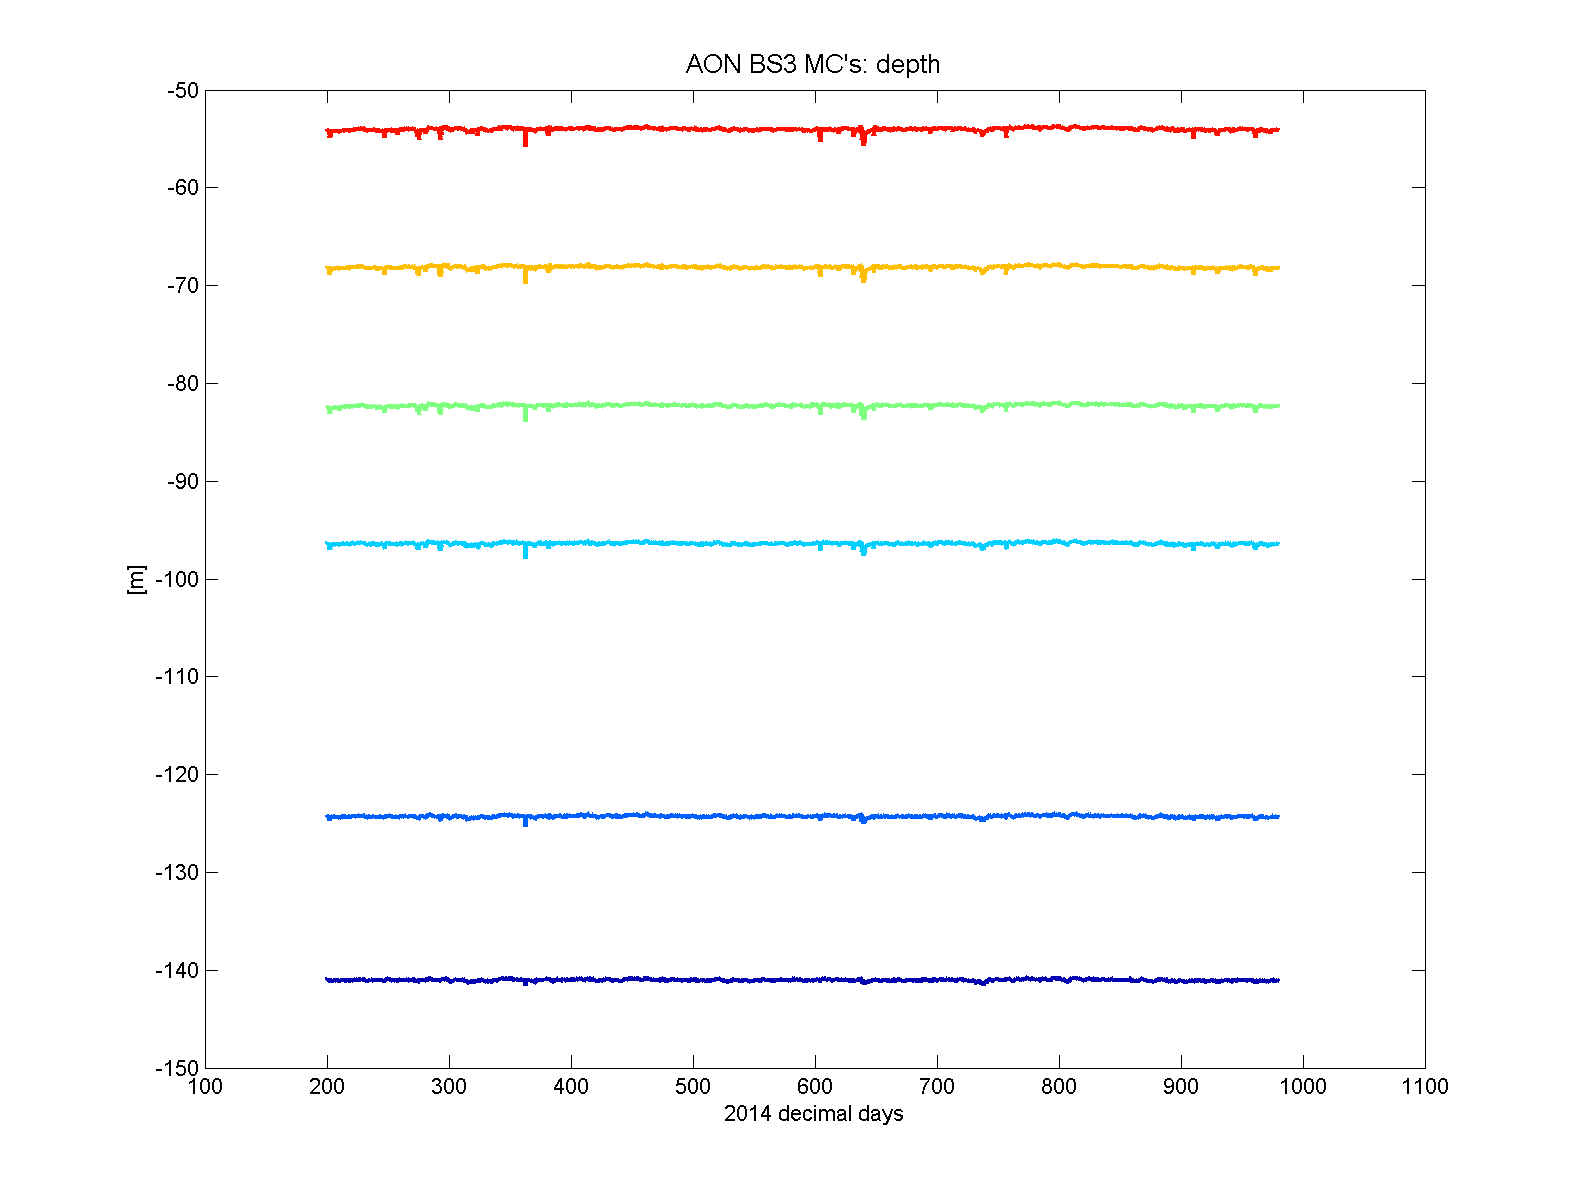
The Coastal Moored Profiler (CMP) of previous deployments had been replaced by a
vertical series of microcats, as illustrated in the mooring diagram. In some sense,
they have been processed "as a unit"; e.g., during editing, it was helpful to compare
neighboring records when deciding on a possible sensor contamination. Therefore,
rather than providing individual links for each microcat, the data processing and
calibration information of all is grouped together below.
Instrument setup and recovery:
The instruments were provided by Brian Hogue Scott Worrilow's mooring shop (who
took over from Scott Worrilow). They were programmed to start on July 8th, 2014
with 900 second (15 min) sampling invervals. Details can be found in the setup
capture files linked to below.
SBE37-SM 485 V 2.3b SERIAL NO. 2134
SBE37-SM 485 V 2.3b SERIAL NO. 2137
SBE37-SM 485 V 2.3b SERIAL NO. 2139
SBE37-SM 485 V 2.3b SERIAL NO. 2140
SBE37-SM V 2.6b SERIAL NO. 5271
SBE37-SM V 2.6b SERIAL NO. 5383
Data processing and calibration:
Following their recovery in 2016, the microcats were shipped to WHOI, where the
data were downloaded by Andrew Davies. They were then sent on to SeaBird Electronics
for a post-cruise lab calibration. Most had drifted little during the deployment:
around 0 to 2 mdeg C for temperature, and around psu for salinity based on
conductivity drift (all conductivity cells drifted "low", as SeaBird calls it).
The calibration sheets, as well as summary plots of the corrected drift, can be
found here.
A clock adjustment was not done here due to a lack of check times. Andy suggested
that none had drifted more than a couple minutes. As a very rough boundary for
clock drift, note that all six records mark the in- and out-of-water pressure changes
at the same record index.
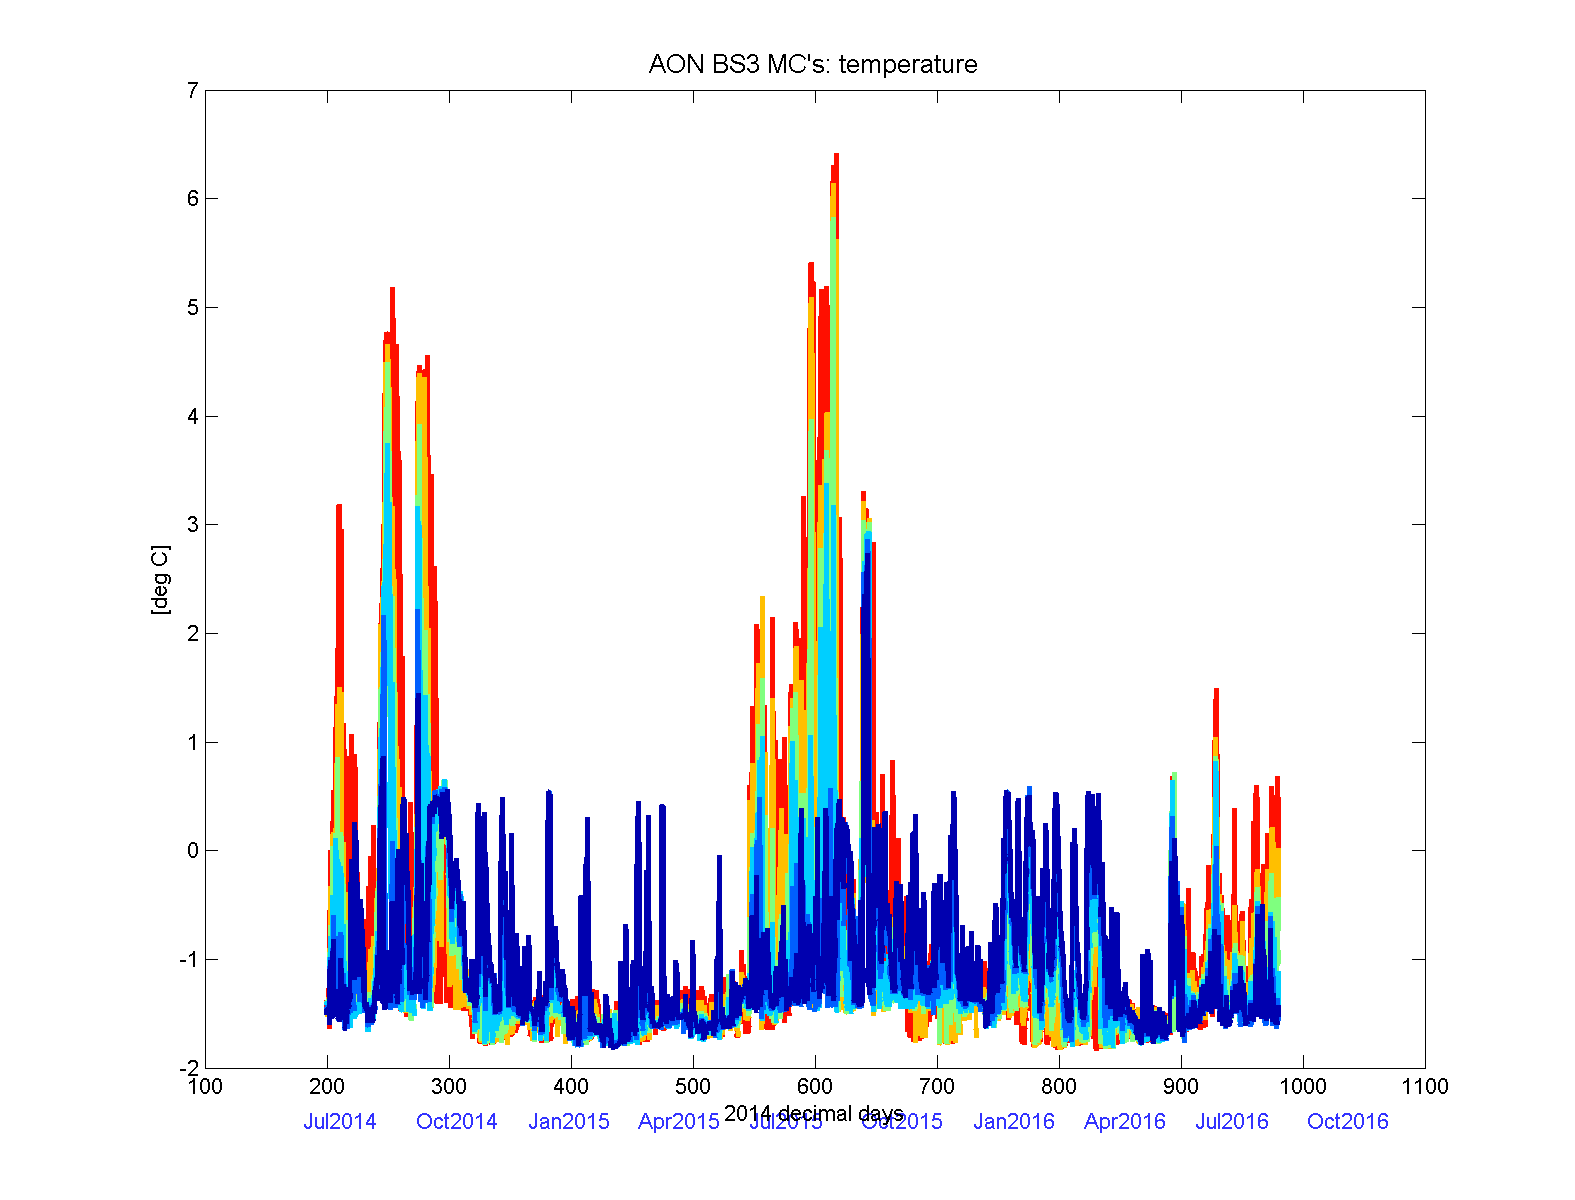
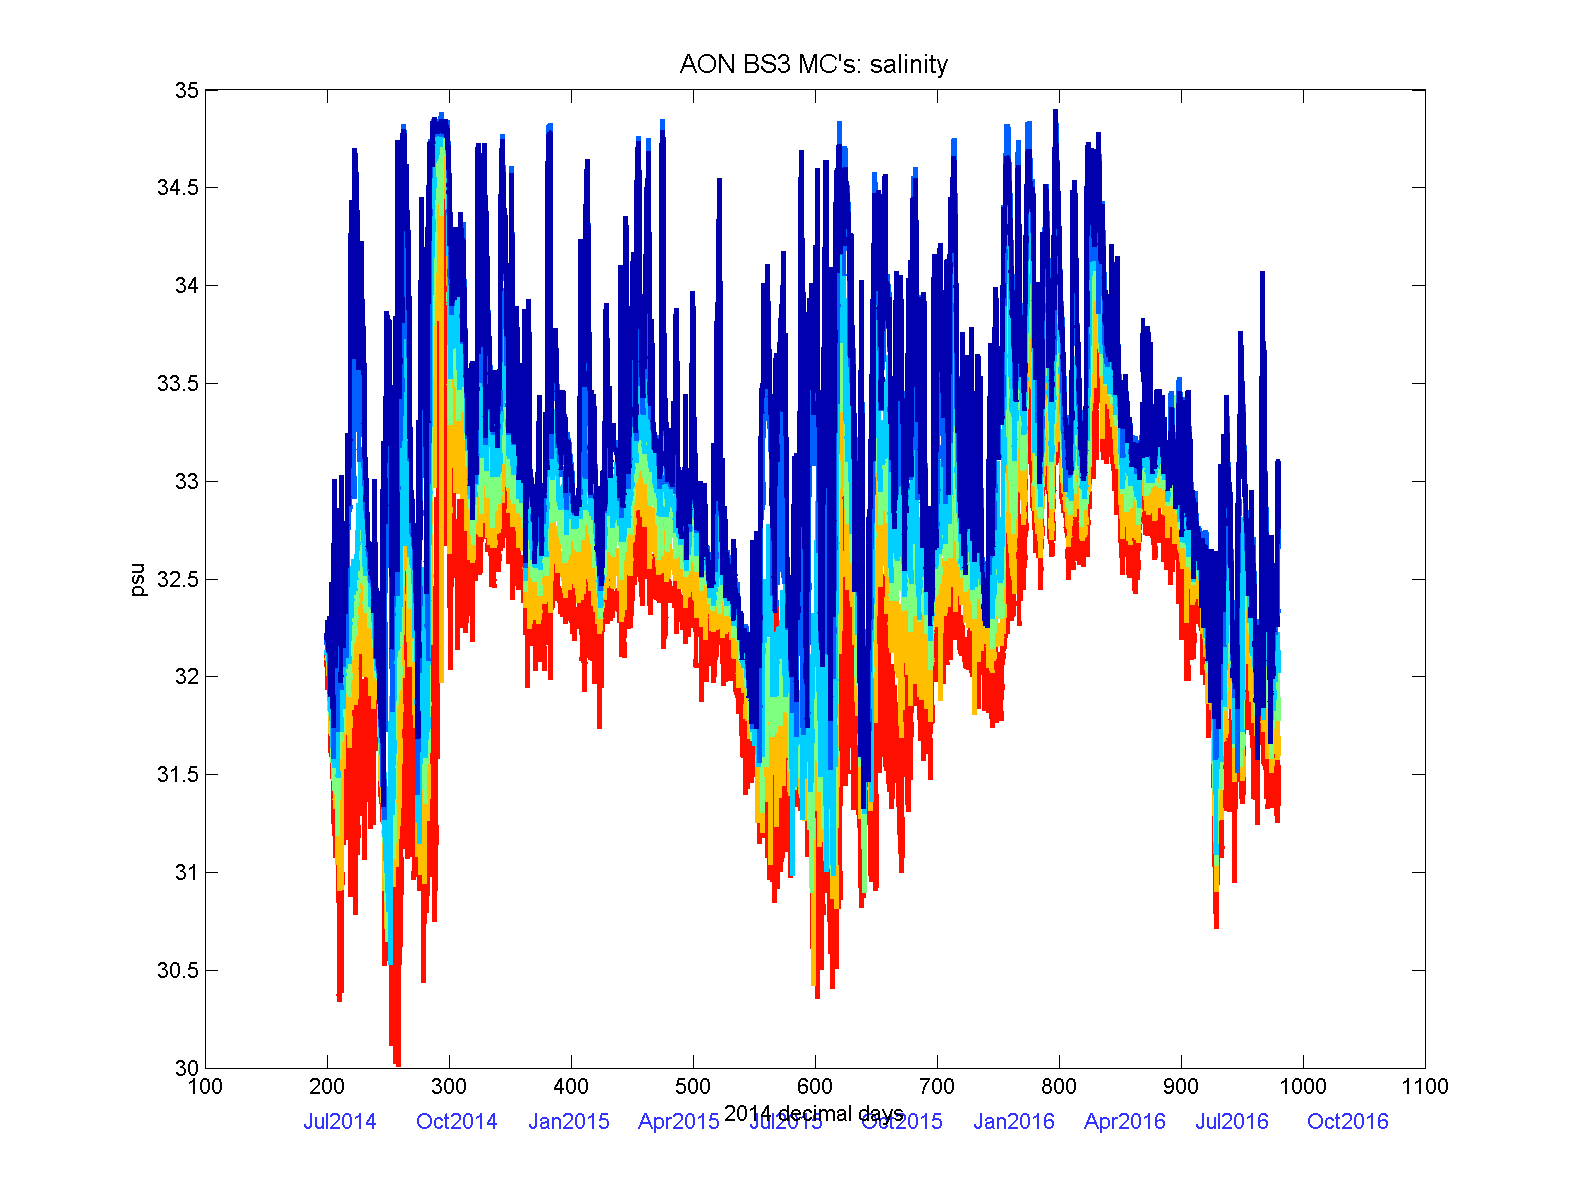
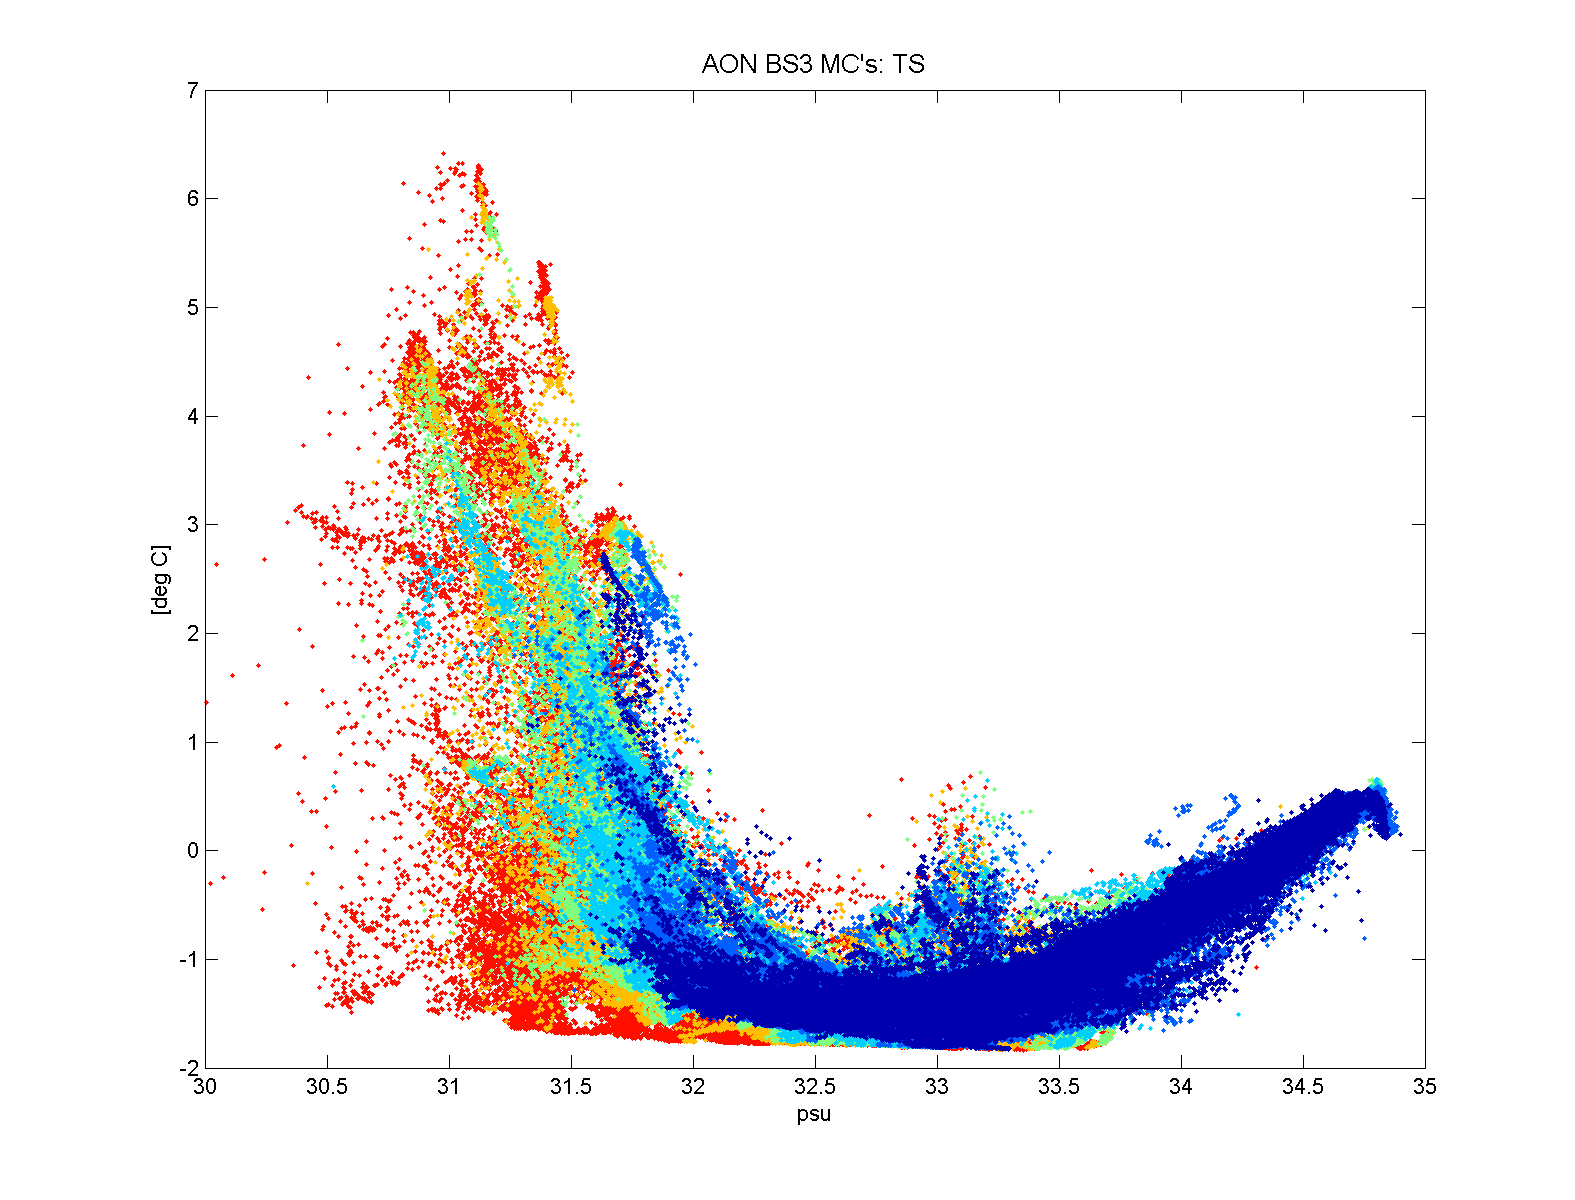
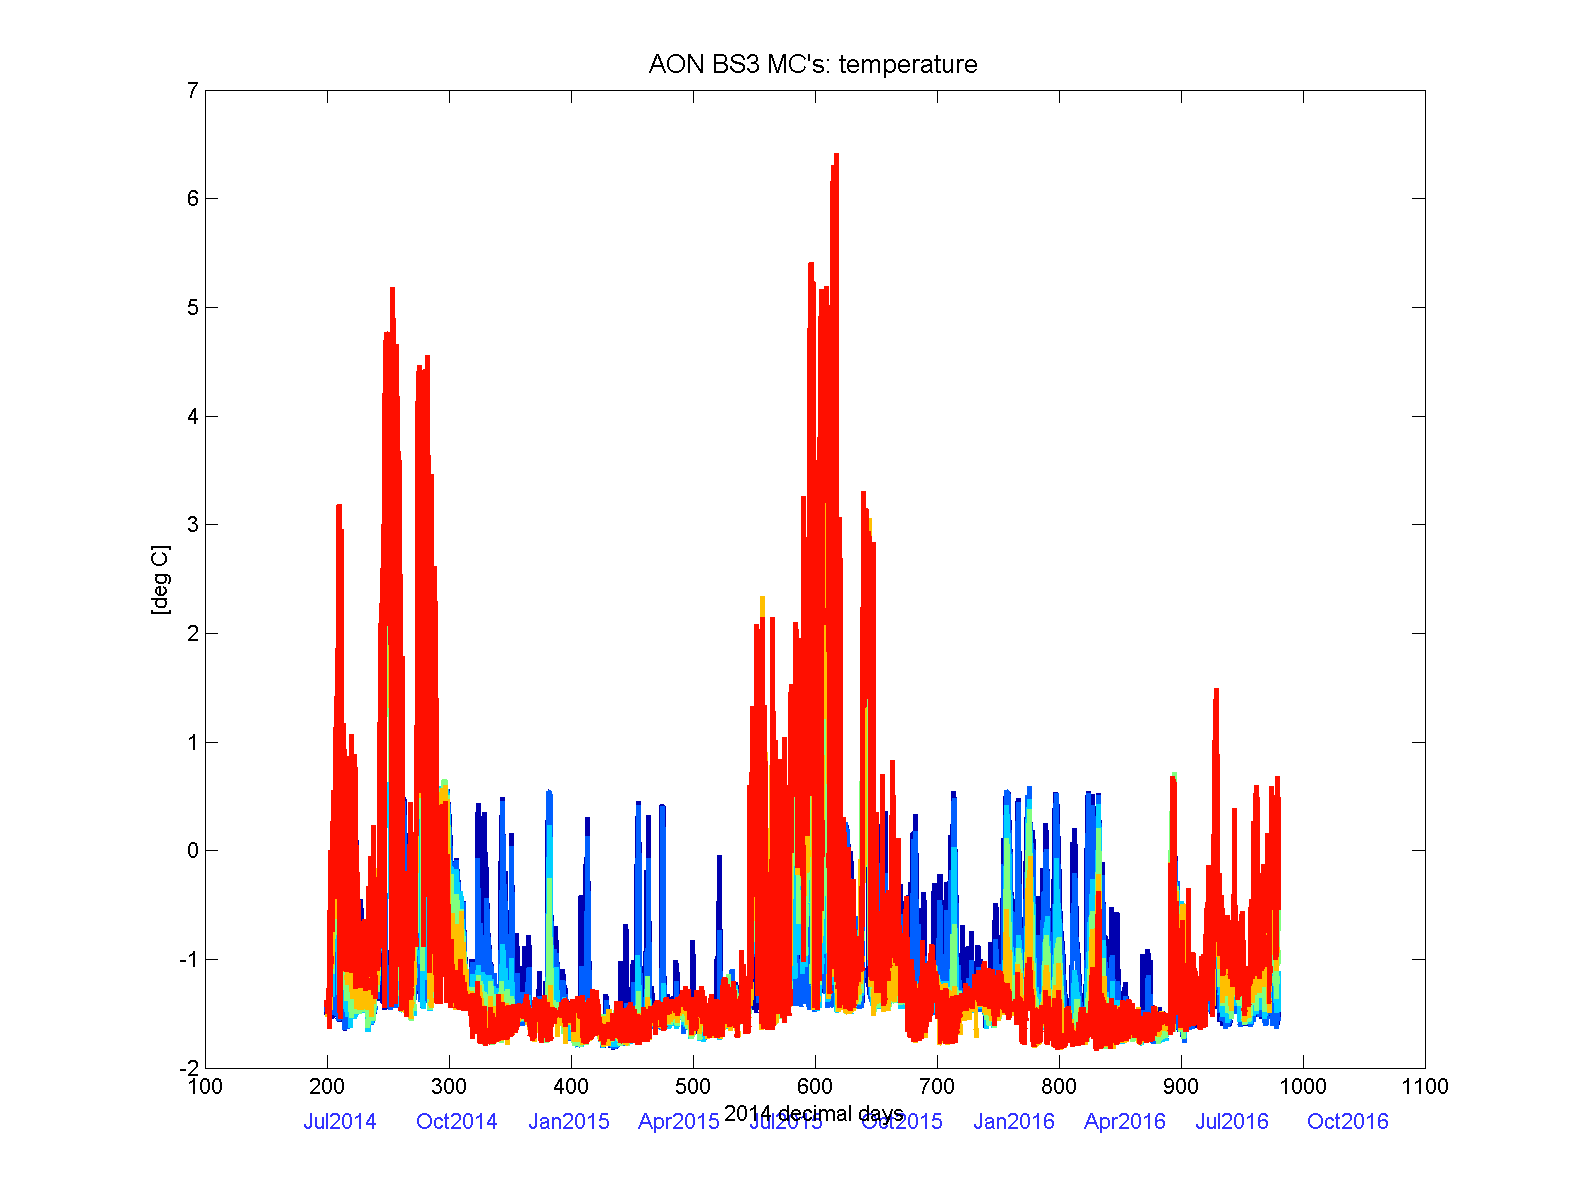
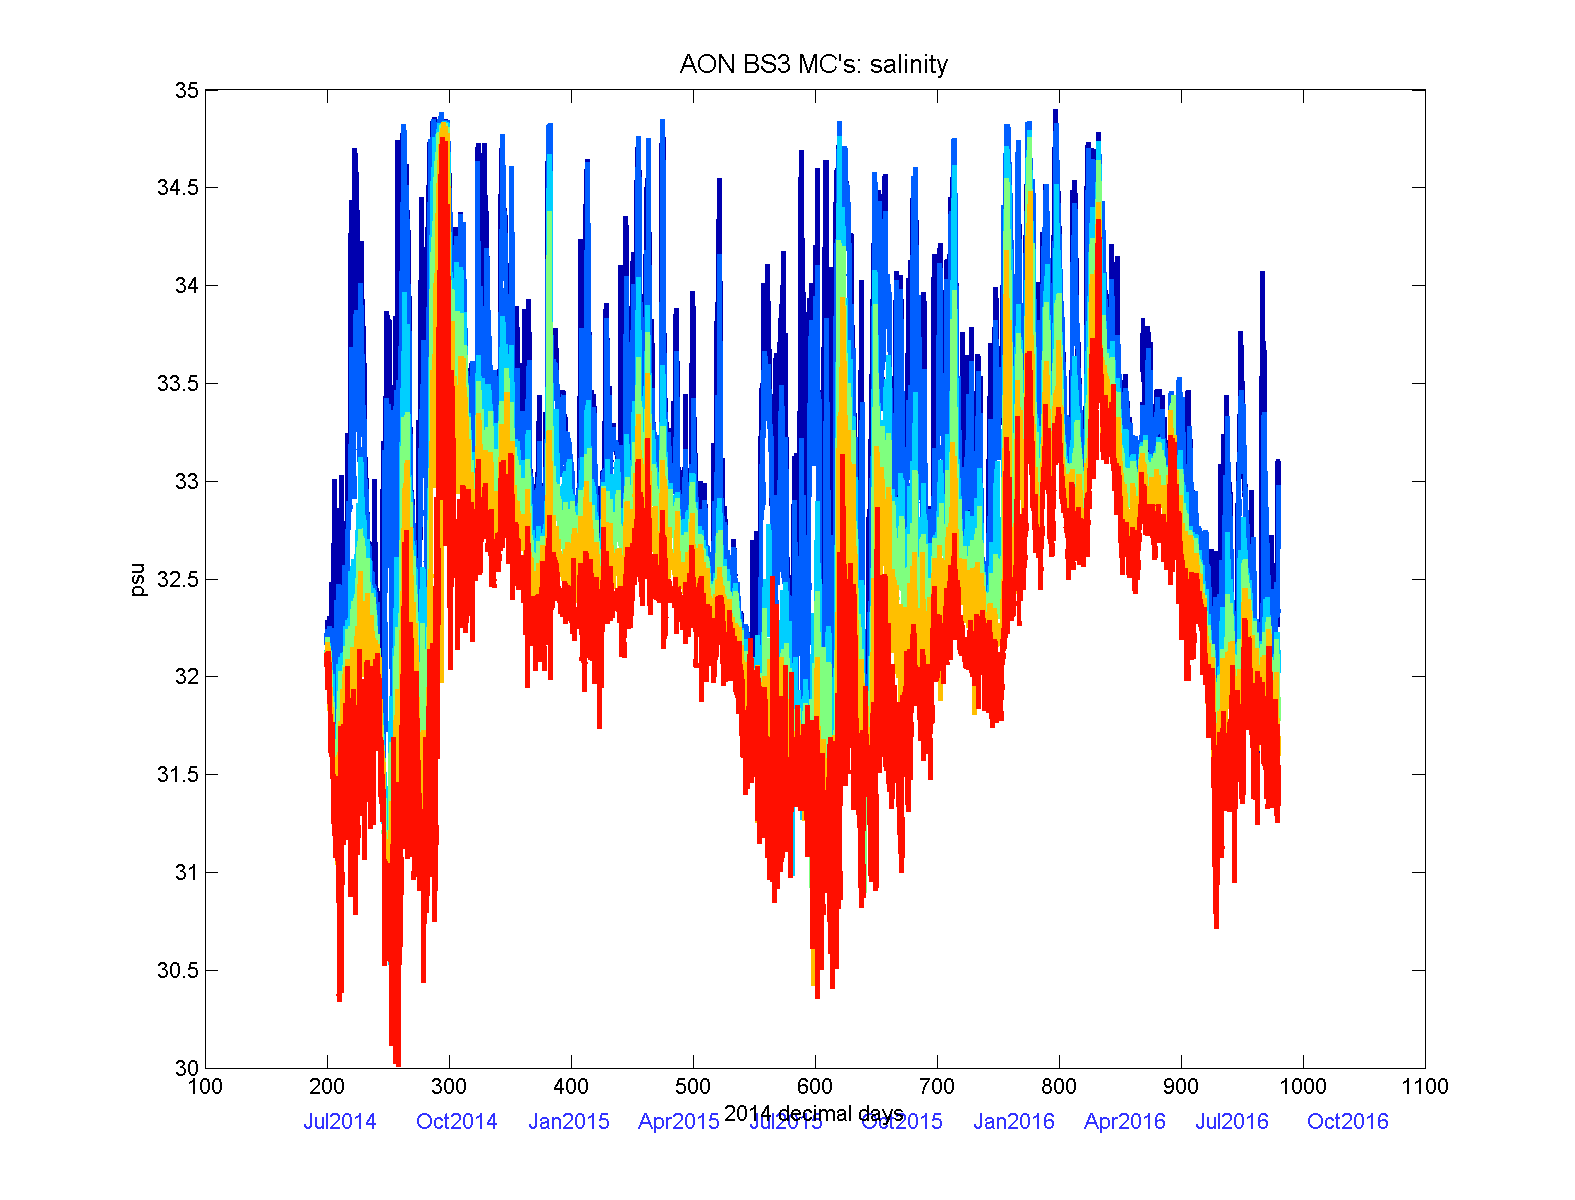
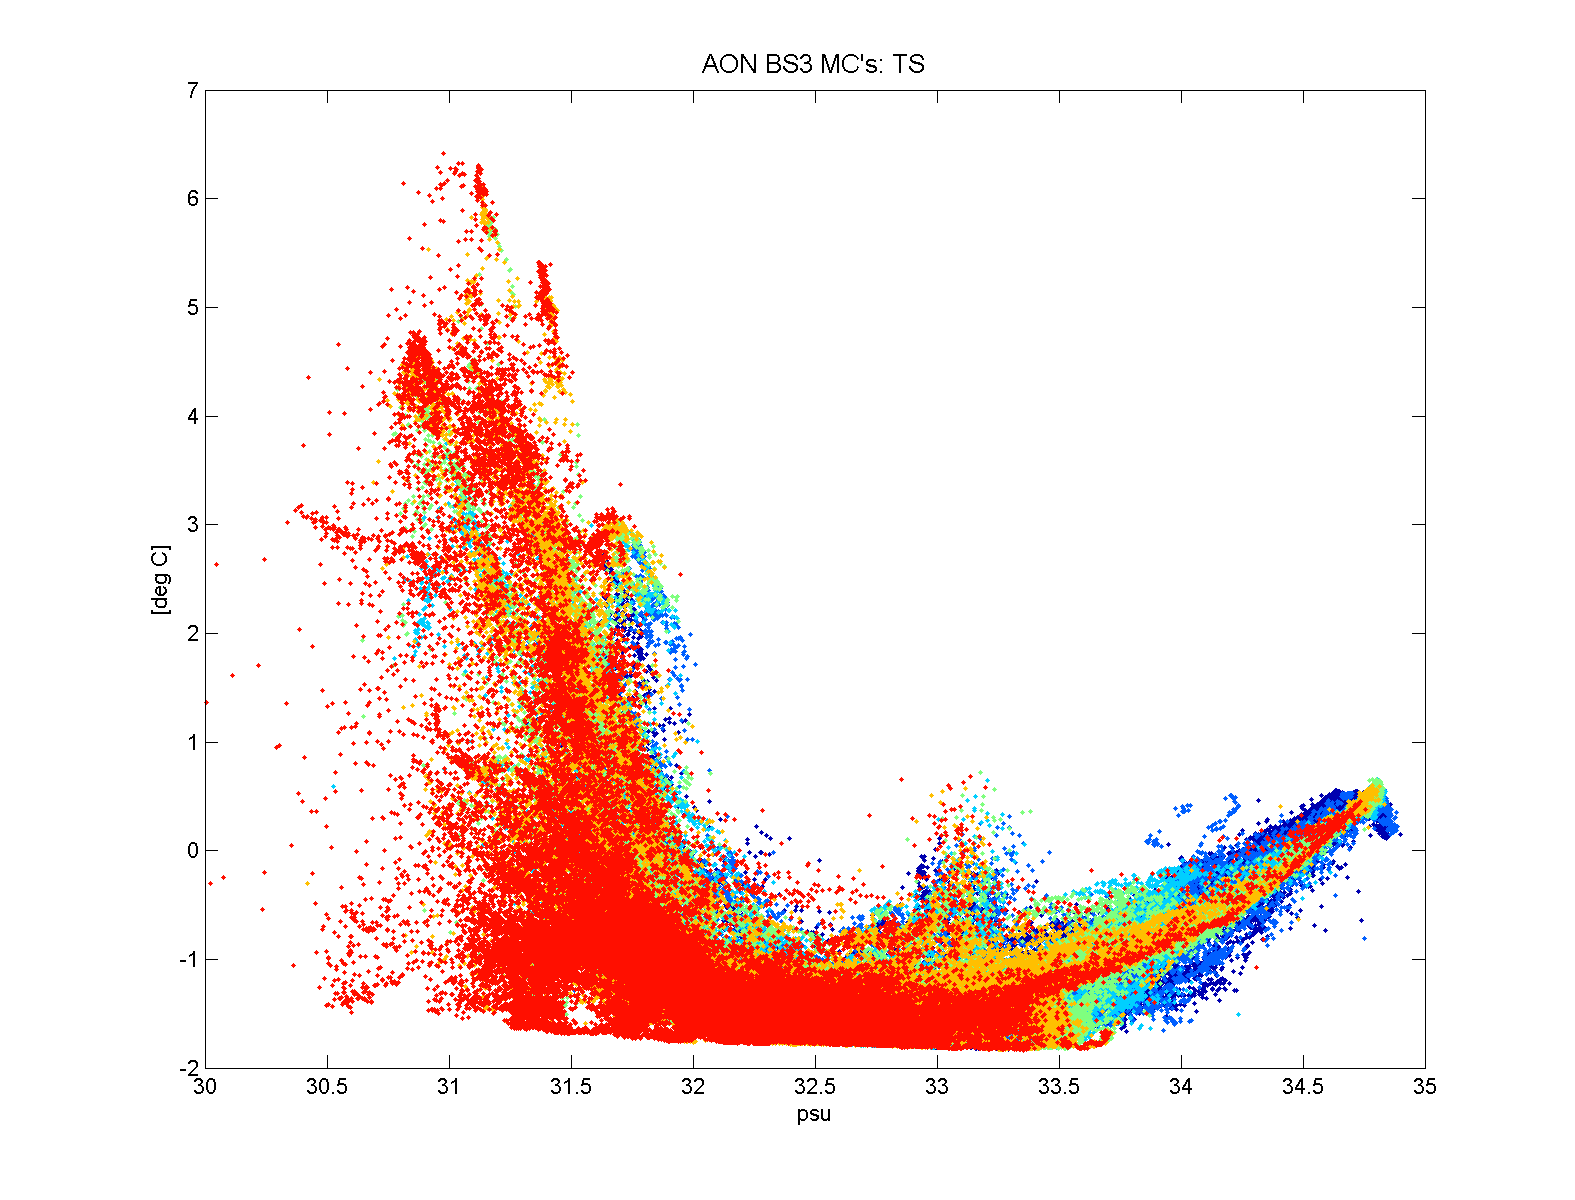
The calibrated sensors underwent visual editing to check for contaminations of the
conductivity cells, and similar common errors. All microcats included a small number
of short-term salinity spikes with corresponding signature in conductivity but not
temperature, typically placing them outside the usual TS relation. These were deemed
conductivity contaminations and removed. In addition, quick changes in TS properties
could trigger salinity spikes. They appeared to relate to insufficient
flushing of the conductivity cell of these un-pumped instruments. Typically,
a sharp change in temperature would be accomodated by a more gentle conductivity
change, with frequently the center point of the conductivity slope corresponding
to the salinity spike. All records included a few such cases of varying amplitude,
with the more significant ones edited out. The shallowest record showed the most
spikes; again, large individual ones were removed, but extended segments had many
spikes of similar amplitude. These portions of the record may better be addressed
with a smoothing filter. We decided to leave such filtering to the eventual user,
in part because filter width would depend on the particular research interest.
Data access
Each microcat dataset was saved in the familiar format of one instrument
per matlab .mat file. On-deck times prior to deployment and after recovery
were nan'ed out. The data files can be found here.
|
|