

Deployment 2010 to 2011:
LR75 ADCP
LR75 ADCP
|
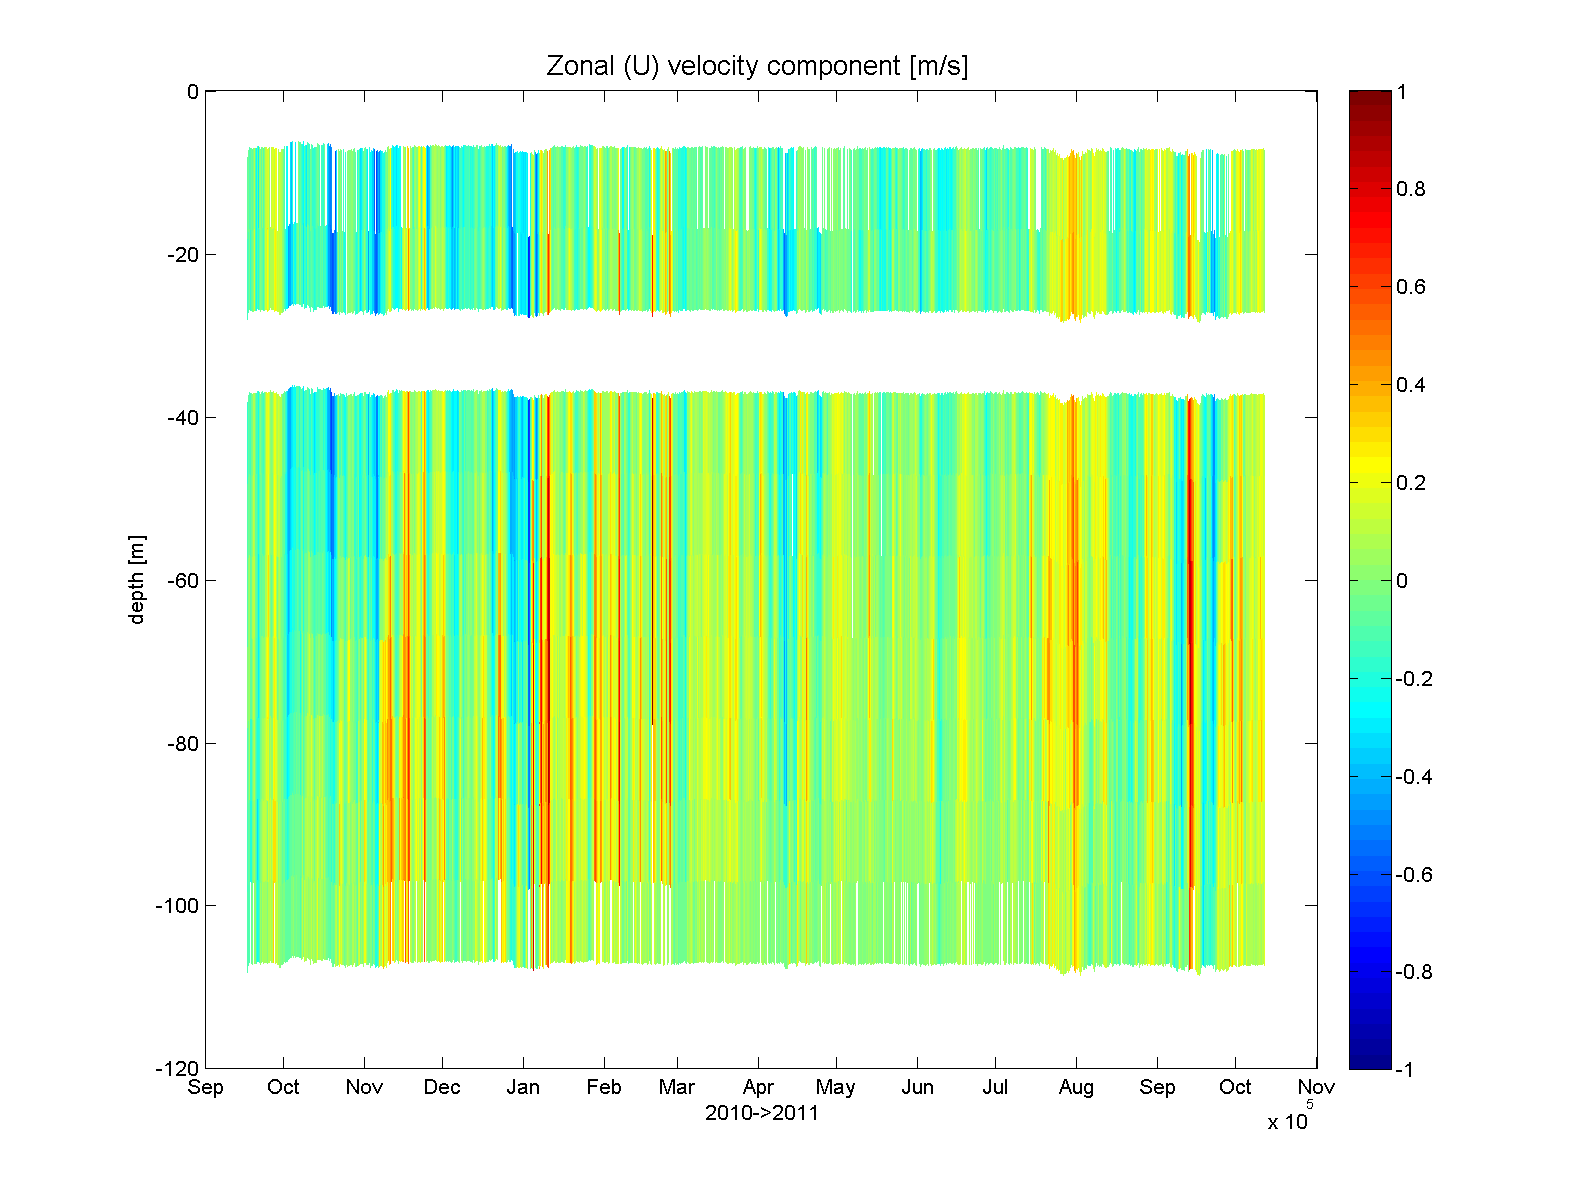
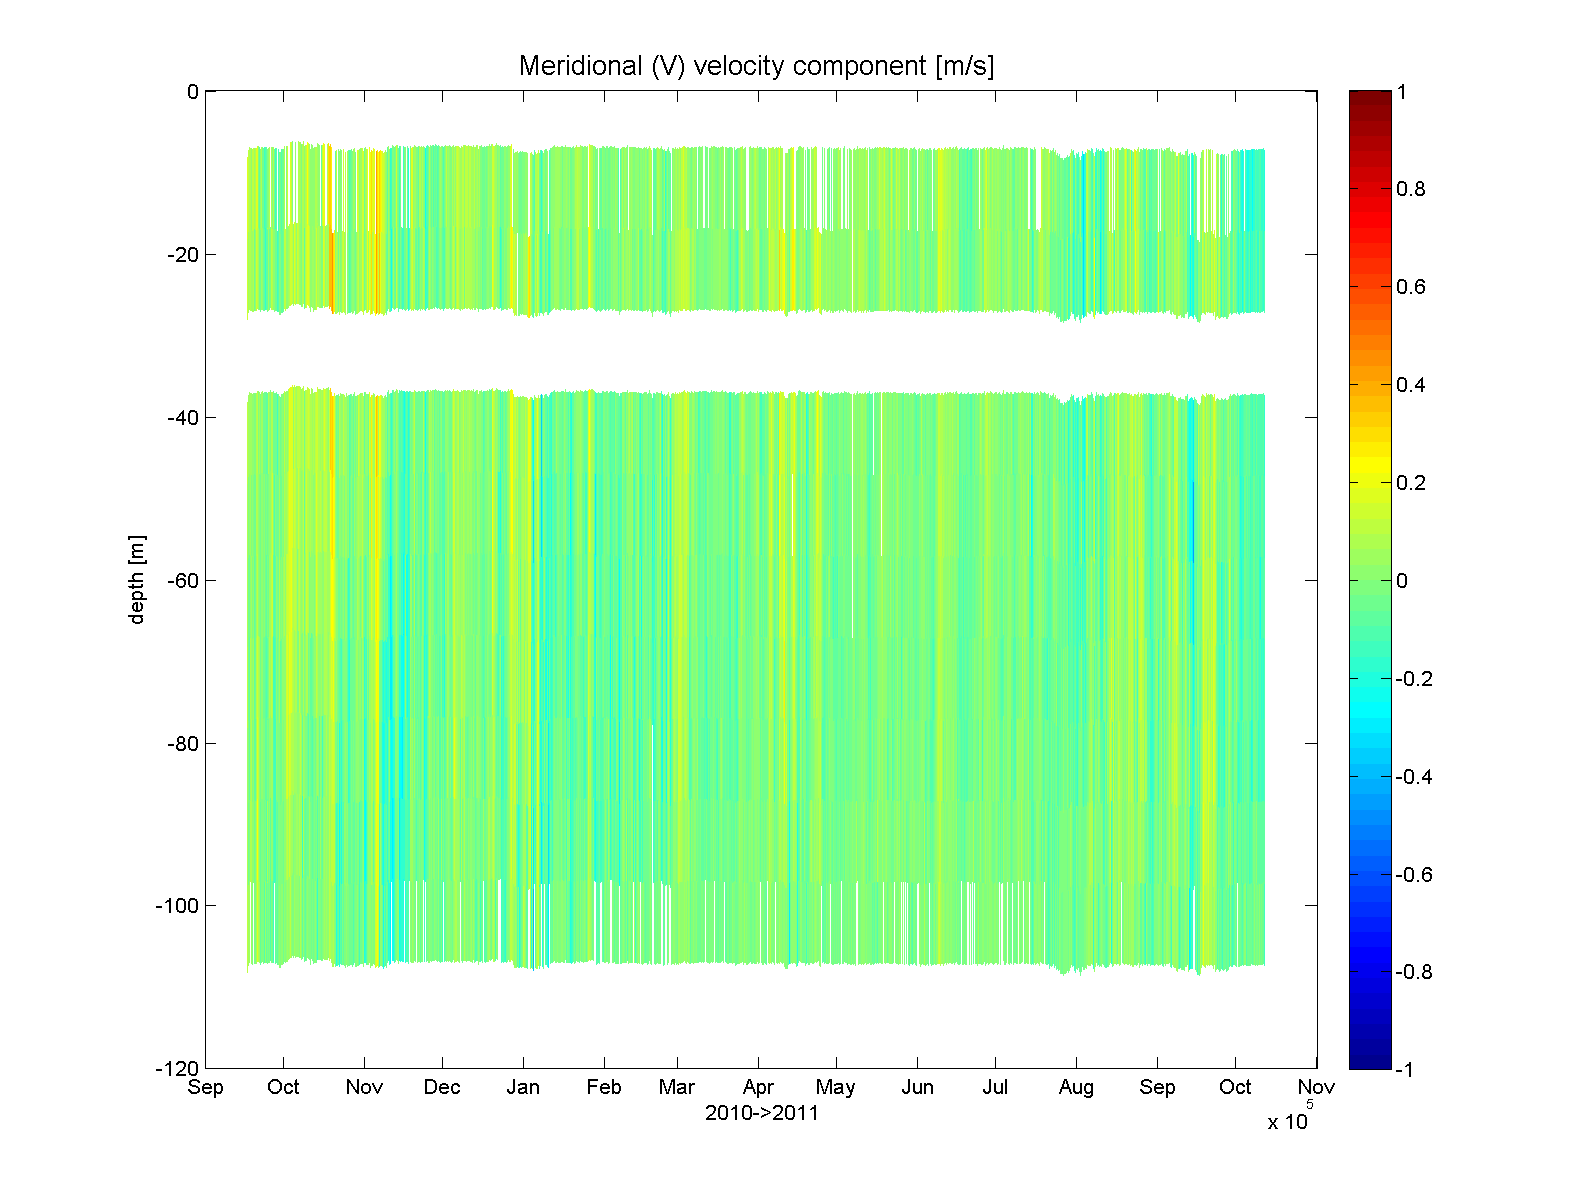
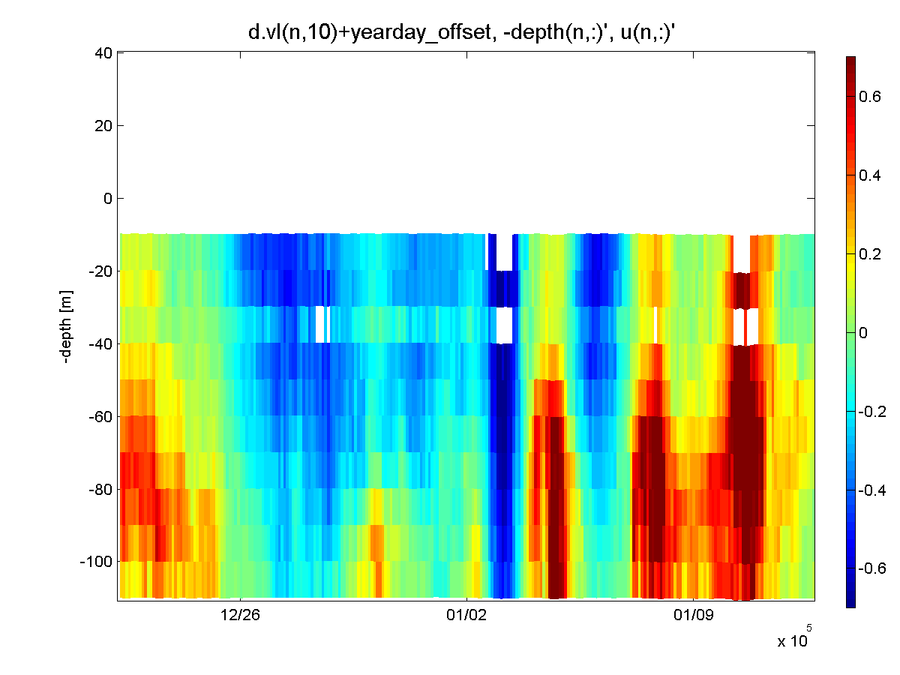
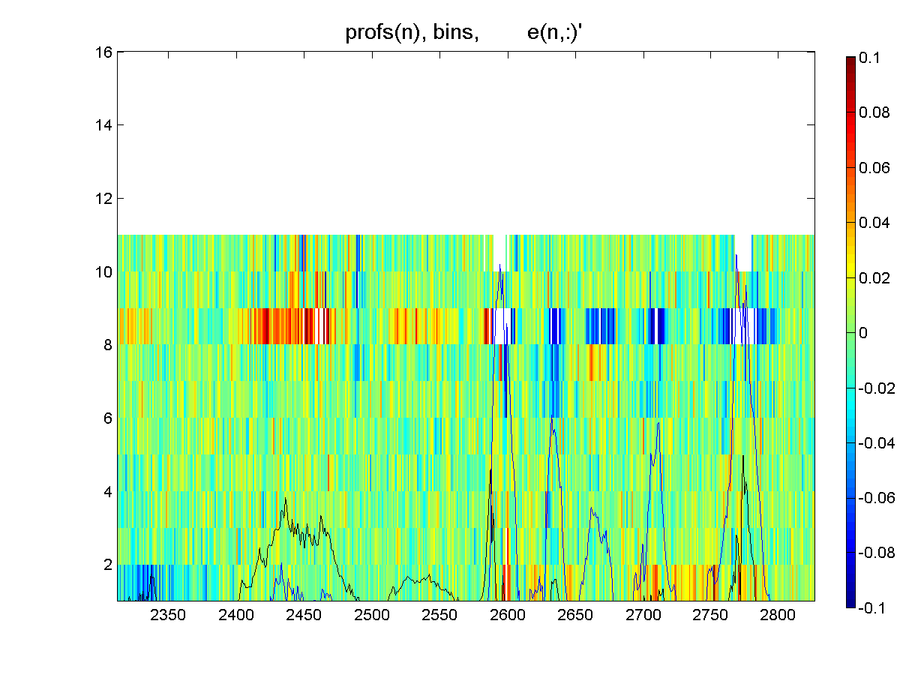
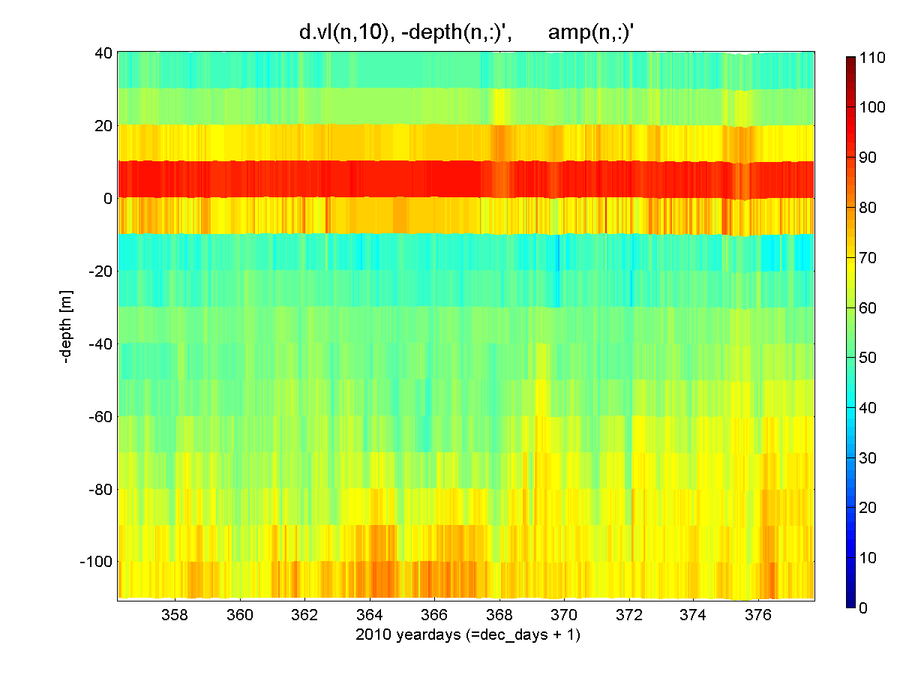
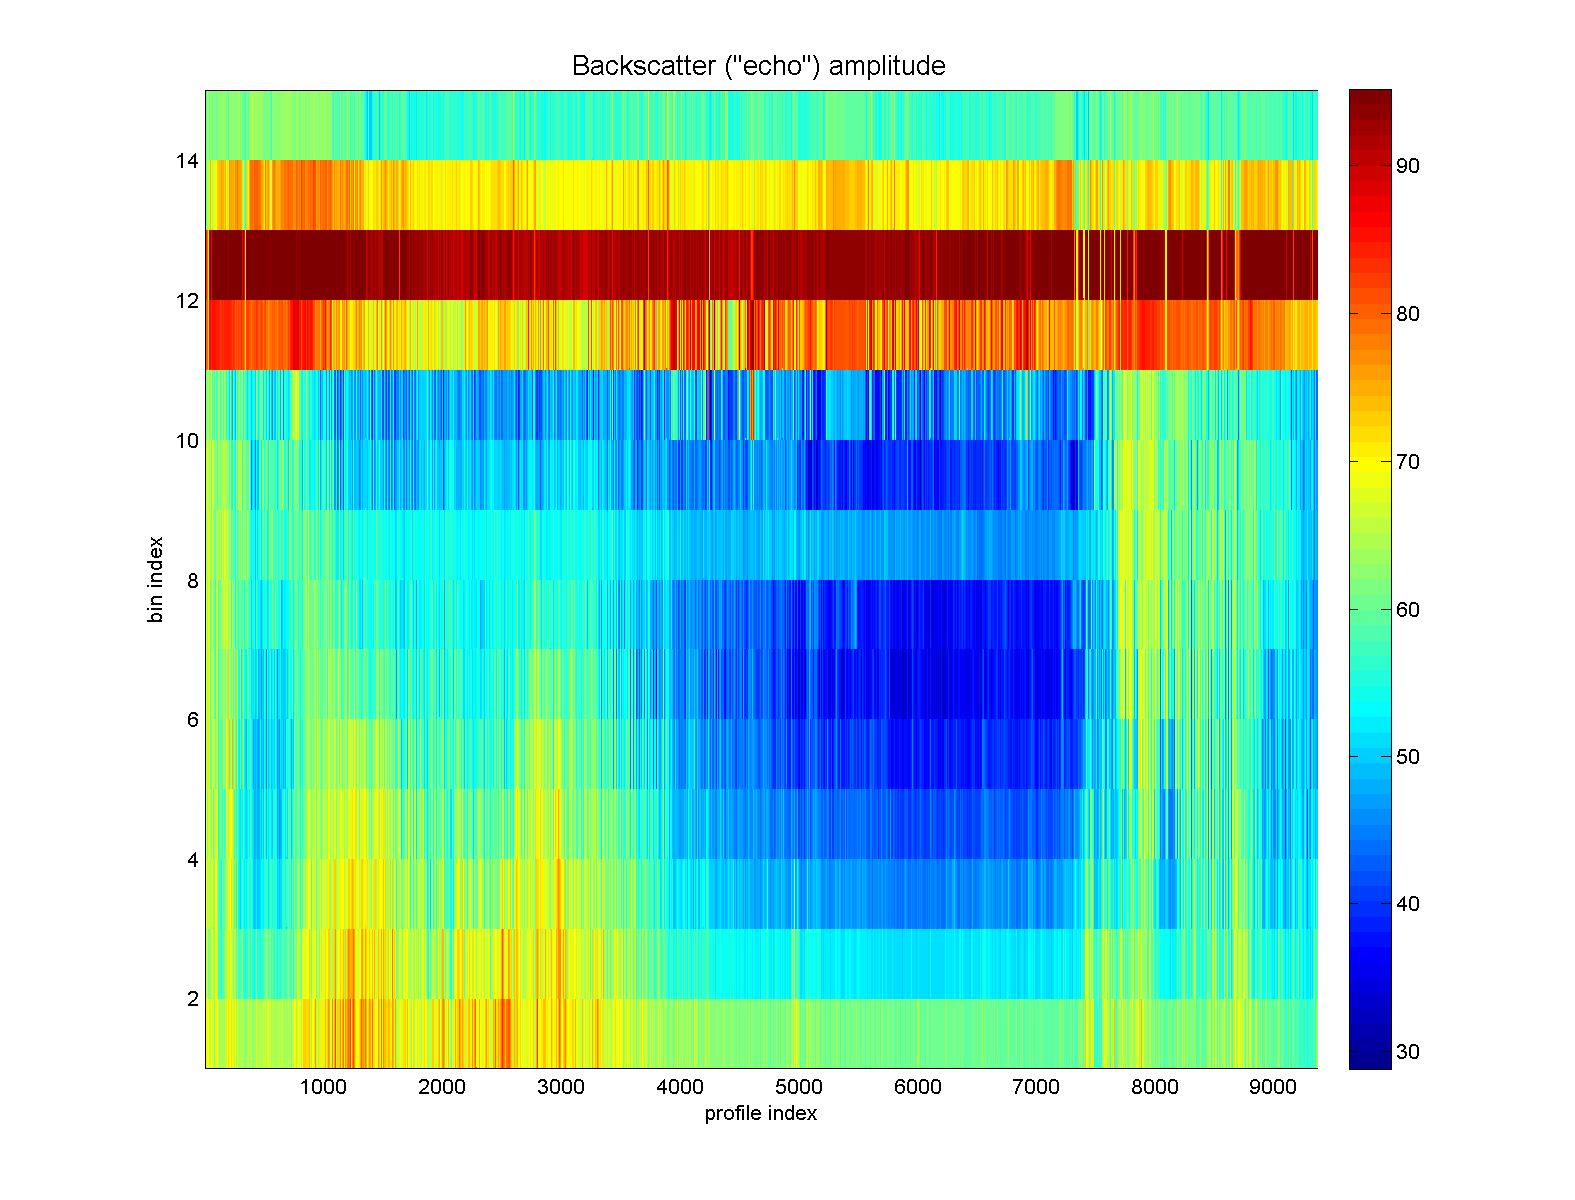
Deployment summary: Duration: Sept 16, 2010 to Oct 11, 2011 Location: BS3 mooring site Variables measured:zonal, meridional velocity Sensor information: 75KHz LongRanger by RDInstruments . Processed data: contained in the matlab file aon11_bs3b_Final1.mat the data format is described in data_format.txt . Data processing: The data were processed with matlab routines provided by D. Torres, modified and augmented by F. Bahr. Following the conversion from RDI's binary format into matlab, the data was rotated to correct for magnetic compass declination. Thresholds were determined for automatic outlier screening based on error velocity and percent_good (typically 0.05 m/s and 30, respectively). Additional manual editing was based on visual inspection of pcolor plots of 20-day subsets. For this dataset, this included a small set of near-surface bins (listed in the file "add_flag_fb.asc"). Finally, conversion routines re-structured the data into the format described in the file data_format.txt linked to under "Processed data". Special considerations for this dataset include: - there appeared to be beam interference from the mooring float, located near 40m depth. Horizontal velocity included outliers, and an increased number of drop-outs for bin 8. Error velocity was frequently higher for this bin, and amplitude showed subtle increases in return echo (better seen when looking at the whole cruise). Since it was not clear how "trustworthy" the non-outlier values were, I decided to wipe (mark as NaN) all zonal and meridional velocities for this bin. - for overall editing, it seemed sufficient to relax the error velocity threshold to 0.1 m/s here. - similar to the 2009->2010 LR75 record, the deepest bin ( #1, for this upward looking ADCP) appeared to show some interference as well, as indicated by somewhat enhanced error velocity. In contrast to bin 8, the interference source was much less obvious here. Backscatter amplitude for this bin would naturally be largest, given its proximity to the transducer. To address this issue, I tightened the editing criterion for error velocity to 0.04 m/s for this bin only. - although the backscatter amplitude maximum clearly indicated the surface reflection to generally start at bin 11, the first sub-surface bin (10) appeared to include episodes of horizontal velocity outliers. They concided with periods of increased error velocity. I therefore also used the tighter 0.04 m/s error velocity editing for bin 10. - on April 2012, I went ahead with the processing even though the microcats (mc) had not yet returned from SeaBird with post-cruise calibrations. From past experience, mc cals tend to make small adjustments to conductivity, and much smaller corrections to temperature (or none at all). I have not seen any adjustment to mc pressure. Therefore, the possible changes to the processed ADCP data are likely negligent. Details of the data processing can be found in my process notes for this dataset. Lastly: mostly for my own reference, I included a page showing the plots of 20-day time series subsests used during manual editing. They show the state of the data after all editing was applied. |
|
|