

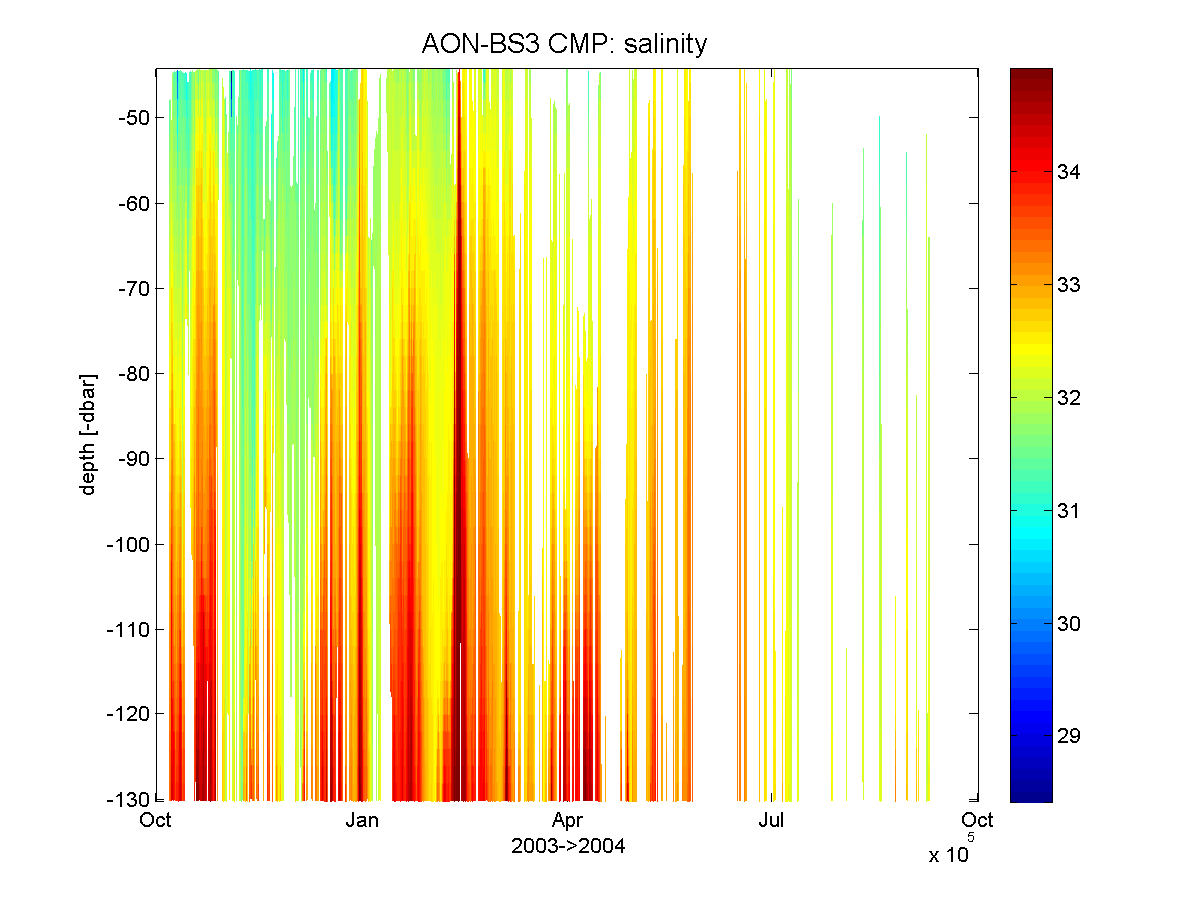
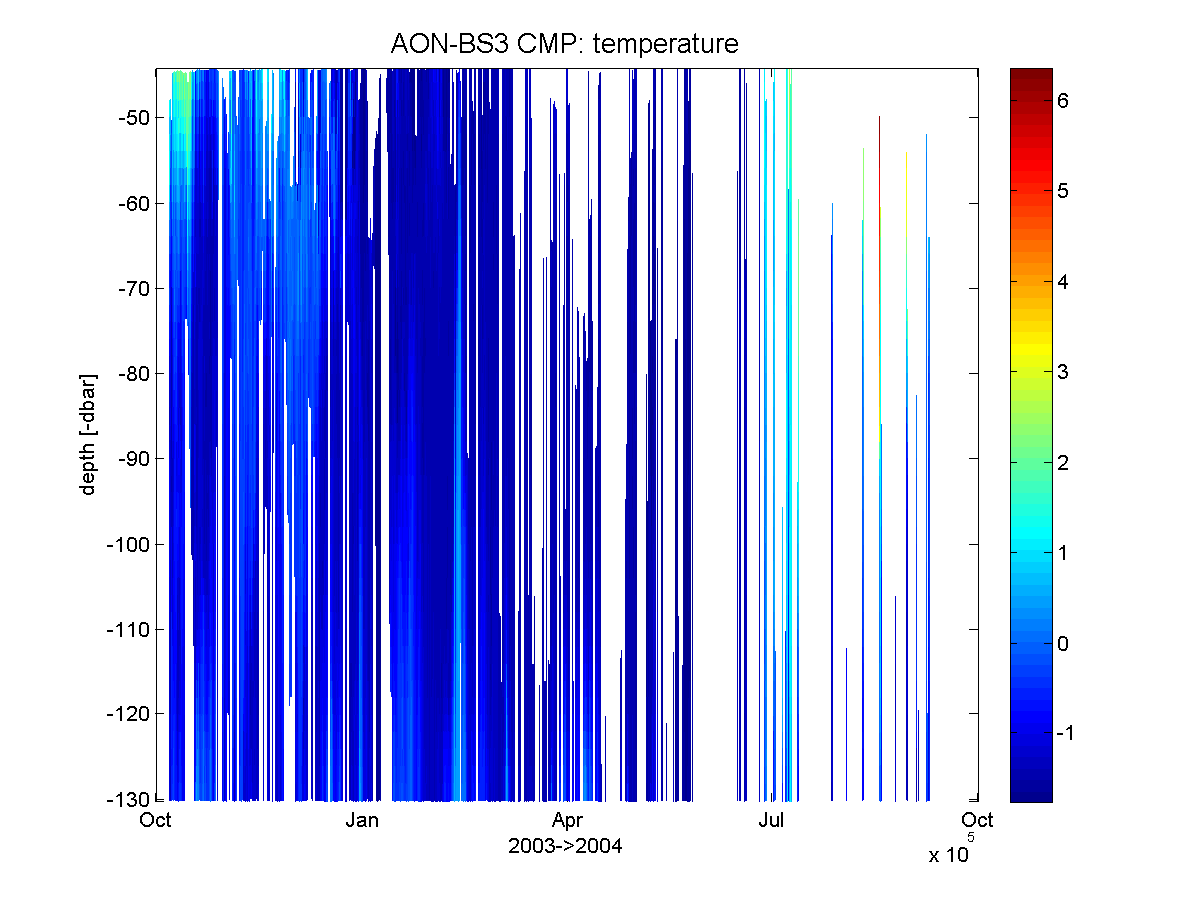
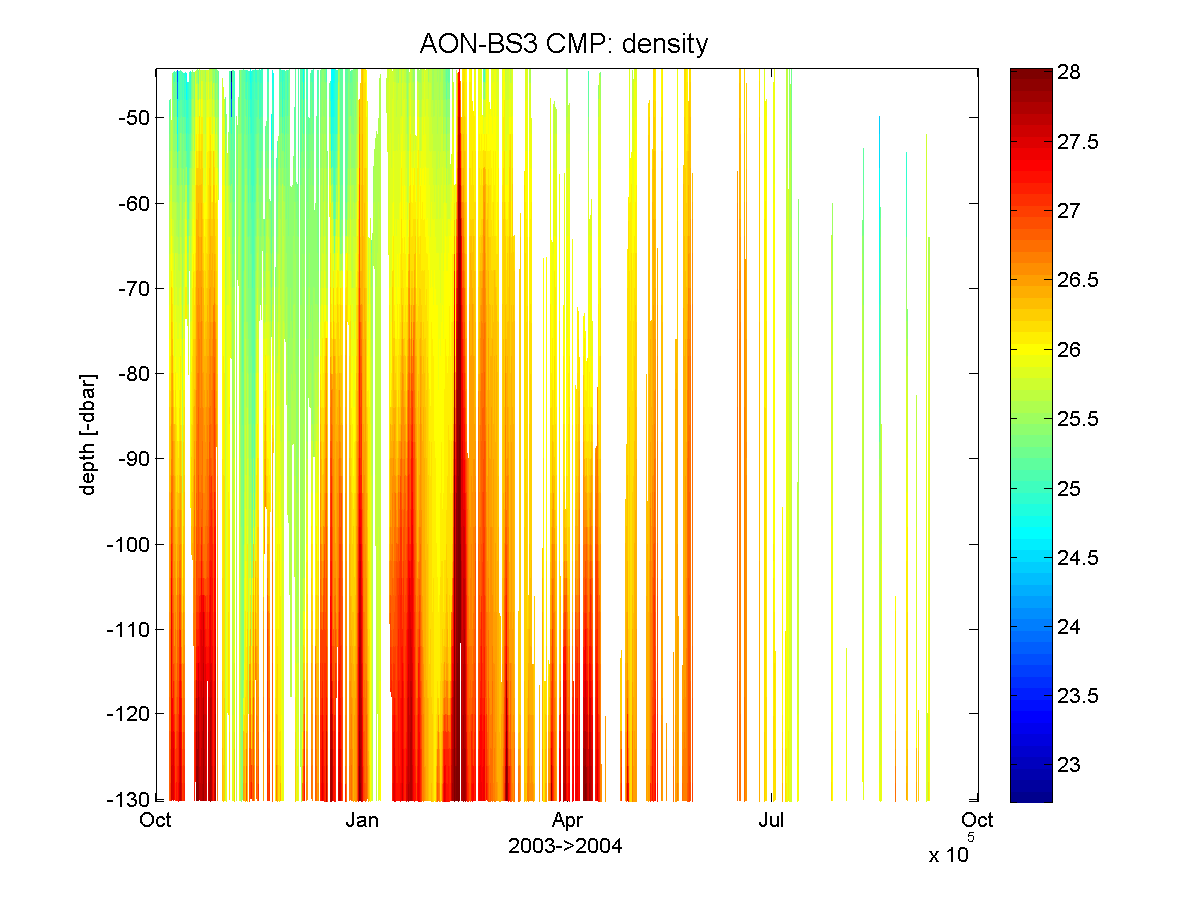
Deployment 2003 to 2004:
Coastal Moored Profiler (CMP)
Coastal Moored Profiler (CMP)
|
Deployment summary: Duration: Oct 7, 2003 to Sept 9, 2004 Location: BS3 mooring site at 71 23.69 N 152 2.81 W Variables measured: pressure, temperature, conductivity Sensor information: CMP is a WHOI-developed instrument similar to the McLane MMP. It was equipped with an EM-CTD ser# 1355, by Falmouth Scientific Inc. Processed data: contained in the matlab files bs3_04.mat provided by Paula Fratantoni. |
|
Data processing: The following was taken from the file "README_MP_pubSBI_04.txt" which accomodated the SBI data archive "http://www.eol.ucar.edu/projects/sbi/all_data.shtml" It outlines the CMP data processing performed by Paula Fratantoni. ==== start quote from "README_MP_pubSBI_04.txt ==== The CTD data has been calibrated, de-spiked, and inspected for fouling events and bad data points have been replaced with NaN values (a detailed data report will be made available in the near future). The files contain a single structure function with the following variables (each row in an array corresponds with a single profile completed by the moored profiler): MP.time day and time of values averaged in each pgrid bin (see below) MP.pgrid center values of the pressure grid used in the bin-average (db) MP.pave average of the pressure values in each pgrid bin (db) MP.cave bin-averaged conductivity (mmho) MP.s_ave bin-averaged salinity (psu) computed from pave, tave, and cave MP.tave bin-averaged temperature (degrees C) The bin-averaging of the MP data looks for all scans within each pressure interval of the nodes in pgrid. The midpoint of each bin makes up the pgrid values. The mean of all the pressures (temperatures, salinities, and conductivities) from MP scans falling within each bin form the pave (tave, s_ave, and cave) vector. The time vectors represent serial time from January 1, 0000 (encoded date using the matlab function DATENUM). ---------- References ---------- Fratantoni, P. S., R. S. Pickart, S. Zimmerman, and M. Schwartz, 2006. Western Arctic Shelf-Basin Interactions Experiment: Processing of moored profiler data from the Beaufort Shelf Edge mooring array. WHOI Technical Report No WHOI-2006-15. ==== end quote from "README_MP_pubSBI_04.txt ==== When generating the overview plots for this page, I noticed long time gaps, which were filled with patches of constant color from the last good profile by matlab's "pcolor" plot tool. Since this looked unrealistic to me, I re-parsed Paula's single-profile .mat files into a new file "bs3_proc1.mat" that contained the same structure "MP", but included nan's for the edited-out profiles. This version was then used to generate the pcolor plots shown here. |